Grafana
The DBmarlin data source plugin for Grafana brings DBmarlin's database performance data into your Grafana dashboards and alert rules. You can chart database activity, list the top SQL and wait events, plot database and host statistics, and overlay DBmarlin alerts, changes and events on any panel. Every table links back to the matching view in DBmarlin.
Requirements
- DBmarlin 6.11 or later.
- Grafana 11.0 or later, self-managed or Grafana Cloud.
- The Grafana server must be able to reach your DBmarlin server over the network. Your browser does not need to, because Grafana makes the requests on its behalf.
The plugin has its own version number, which is independent of the DBmarlin version. See the changelog for what is new in each release.
Install the plugin
Install DBmarlin from the Grafana plugin catalog:
- In Grafana, go to Administration > Plugins and data > Plugins.
- Search for DBmarlin and click Install.
On a self-managed Grafana you can also install it from the command line, then restart Grafana:
grafana cli plugins install dbmarlin-dbmarlin-datasource
Create a DBmarlin user for Grafana
Everyone who can query the data source in Grafana sees what this DBmarlin user sees. Create a dedicated user with only the access you want to expose, for example read-only access limited to particular tags. See Role-based Access Control and Tag-based access control.
If your DBmarlin server has no authentication enabled, you can leave the username and password empty.
Add the data source
- In Grafana, go to Connections > Data sources > Add new data source and choose DBmarlin.
- Enter the URL of your DBmarlin server, for example
https://dbmarlin.example.com:9090. - Enter the Username and Password of the DBmarlin user. Grafana stores the password encrypted.
- Click Save & test.
Grafana reports how many instances the user can see, for example Connected to DBmarlin: 12 instances visible.
Settings
| Setting | Use |
|---|---|
| URL | The address of your DBmarlin server, as reachable from the Grafana server. |
| Username, Password | The DBmarlin user the data source connects as. |
| Skip TLS verify | Turns off certificate checking. Use only for testing. |
| TLS CA certificate | The PEM certificate of the CA that signed your DBmarlin server's certificate, for servers with a private CA or a self-signed certificate. Prefer this to skipping verification. |
| UI URL | The address your browser uses for DBmarlin, if it differs from the URL above. Links back into DBmarlin use it. |
| Timeout (s) | How long to wait for each request to DBmarlin. The default is 60 seconds. |
| Max concurrent requests | The most requests the data source sends to DBmarlin at once, across all panels. The default is 8. Lower it to protect a busy DBmarlin server. |
| SQL text | Whether to show full SQL, truncated SQL, or no SQL text, for sites that must not expose statements. |
Query data
Create a panel, choose the DBmarlin data source, pick a Query type and select one or more Instances.
| Query type | What it shows |
|---|---|
| Activity time series | Database time per instance over time. Choose a metric (average active sessions, wait time, wait count or average wait time). Choose several instances to see them as separate series, or switch on Combine instances to add them together. Optionally Group by wait event, SQL, session, user, database, client, program or module. DBmarlin shows the Top N values, and Show other adds everything else as one series. |
| Activity top N table | The biggest consumers of database time by one dimension (wait event, SQL, session, user, database, client, program or module), with wait time, share of the total, average active sessions, wait count and average wait. Each row links to DBmarlin. |
| Activity total per instance | The total activity of each instance over the time range, suited to bar gauges that compare instances. |
| SQL statistics top N table | SQL statements ranked by any statistic DBmarlin collects for the database type, such as duration, executions or reads, with extra columns of your choice. |
| Database statistics | The statistics DBmarlin collects for the instance's database type, charted over time. |
| Host metrics | CPU, memory, I/O and disk utilisation of the instance's hosts. |
Grouping and top N on the activity time series need DBmarlin 6.11 or later.
Annotations
Overlay DBmarlin events on any time series panel:
- Open the dashboard Settings > Annotations and click Add annotation query.
- Choose the DBmarlin data source.
- Choose the Instances, and which events to Show: alerts, changes, and custom events such as deployments.
Events cover the selected instances and their hosts.
Dashboard variables
Create a dashboard variable of type Query with the DBmarlin data source to list instances. Use it in your queries to build a single dashboard that works for any instance.
Ready-made dashboards
Two dashboards come with the plugin. Import them from the Dashboards tab of the data source settings:
- DBmarlin - Fleet overview. Activity per instance, the busiest instances, and the top wait events and SQL across your fleet.
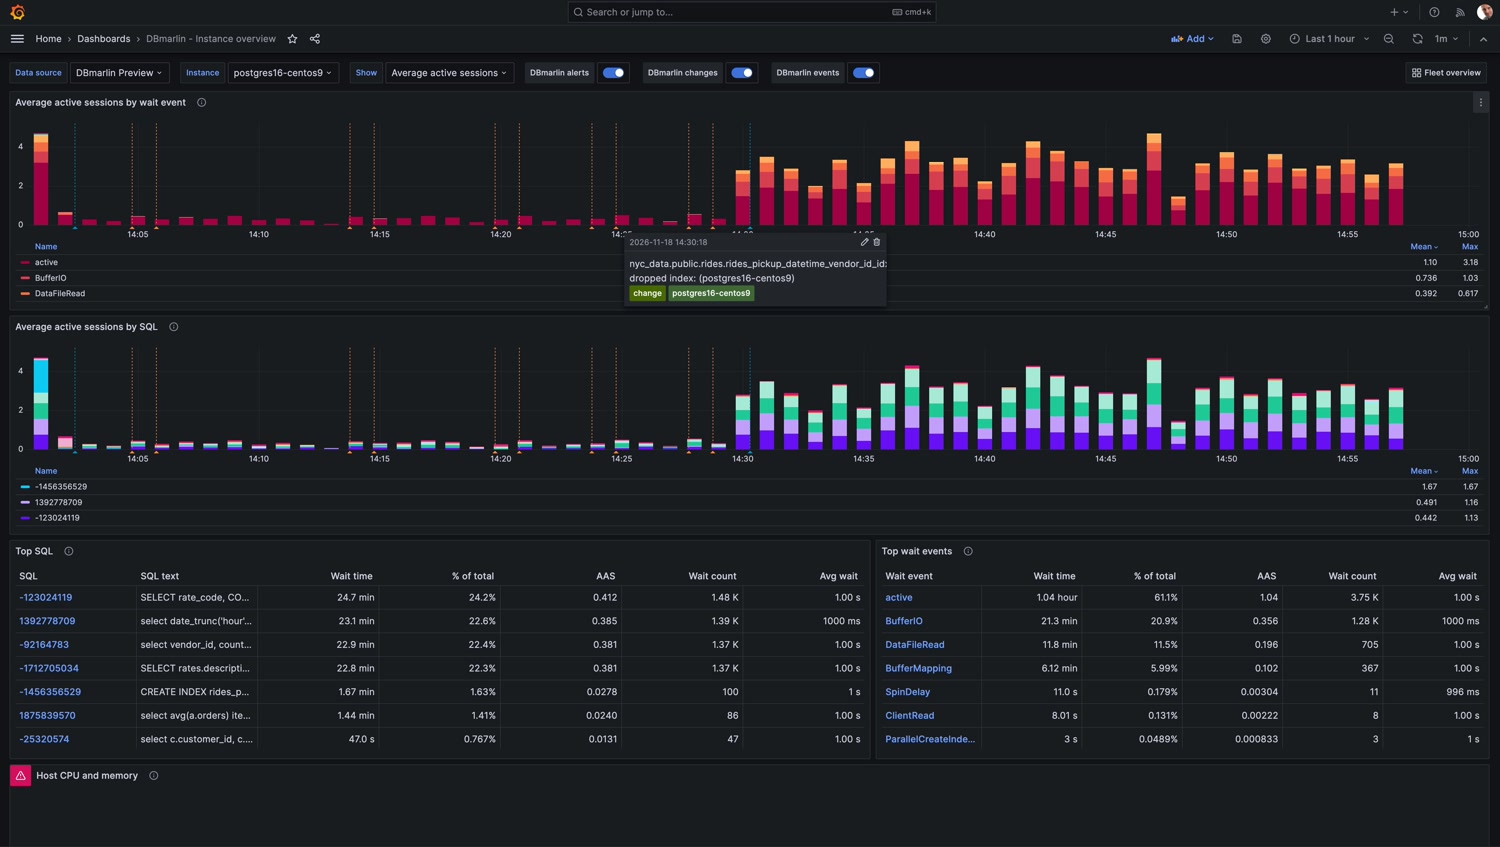
- DBmarlin - Instance overview. Activity by wait event and by SQL, the top SQL and wait events, and host CPU and memory, for one instance chosen with a variable.
Both let you switch between average active sessions and wait time, and toggle DBmarlin alerts, changes and events.
Grafana alerting
DBmarlin queries work in Grafana alert rules. Create an alert rule, choose the DBmarlin data source, and use a time series query type.
Troubleshooting
| Message or symptom | What to check |
|---|---|
| Enter the DBmarlin URL | The URL setting is empty. |
| Cannot reach DBmarlin at ... | The Grafana server cannot connect. Check the URL and port, firewalls, and name resolution from the Grafana server, not from your browser. For HTTPS errors, check that the certificate is trusted, and add the CA certificate in the settings. |
| Connected, but this user can see no instances (check the user's tags) | The DBmarlin user has no access to any instance. Check the tags and permissions assigned to the user in DBmarlin. |
| DBmarlin did not answer within N s; narrow the time range or reduce top N | The query took longer than the timeout. Use a shorter time range, a smaller Top value, or raise the Timeout. |
| Links open the wrong address | Set UI URL to the address your browser uses for DBmarlin. |
| Grouping or top N options missing or failing | These need DBmarlin 6.11 or later. |
Security
- The data source connects to DBmarlin as one user. Every Grafana user who can use the data source sees the data that user can see, so give the DBmarlin user only the access you want to share.
- Use HTTPS between Grafana and DBmarlin. The plugin sends the username and password with each request.
- The plugin does not send any usage or tracking data anywhere. It only talks to the DBmarlin server you configure.
- Set SQL text to None or Truncated if SQL statements must not be visible in Grafana.
Get help
- Report a problem or request a feature: GitHub issues.
- Source code and changelog: github.com/DBmarlin/dbmarlin-grafana-datasource.