About Database Wait Events
🏠 Knowledge-base home > Wait Events
What are database wait events?
When a database SQL statement executes it is generally doing one of two things:
- Using CPU
- Waiting on something
Using CPU (Not waiting)
"Using CPU" is when the session is not waiting for anything else. Depending on the database, you will see the session is shown as "active" (PostgreSQL), "ACTIVE" (Oracle), "running" (SQL Server), "Executing" (MySQL 8.0.17+), "Sending data (older MySQL versions) or "EXECUTING" (IBM Db2)
Note that, when you see a session in one of these states, it doesn't always mean it is using CPU. In some cases, for example in PostgreSQL, the session could be "active", but the session's process could be waiting on CPU at the Operating System level, if the host CPU is 100% utilized. This is because the database engine sometimes is not aware of external contention.
Waiting on Something
“Waiting on something” can mean any one of a long list of different type of "wait events" that the different database vendors provide in order to aid tuning. Wait events generally fall into one of the categories below:
- Disk I/O - Waiting to read blocks from disk.
- Network - Waiting for a network read or write to complete.
- Concurrency - Locks on memory structures sometimes known as latches can delay query execution.
- Locking - Table, row or application locks that prevent transactions completing to ensure database consistency.
- Idle - Session is waiting for more work to do.
- Commit - writing redo information to disk after a transaction commit.
- Cluster - In clustered systems there can be time spent between the nodes of the cluster.
- Admin - The database is undergoing some kind of maintenance such are rebuilding an index.
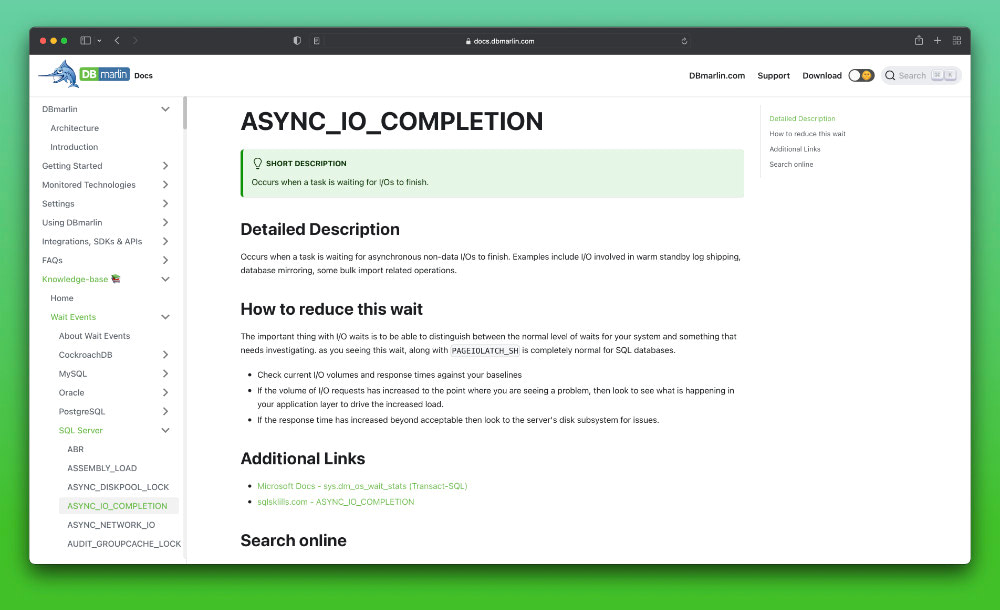
In this knowledge-base we describe 1000+ wait events across 6 different database types so you can better understand what they mean and what you can do to reduce them.
How do I tune database wait events?
Depending on the type of wait, the action you need to take will be different. The first step is to identify which wait events to focus on (see below) and then if you determine that your database is spending a significant amount of time waiting on a certain type of event, then you can use this knowledge-base to further understand what it means and any suggested actions.
How do I know which wait events my database is waiting on?
For different databases there are different internal or performance schema tables, views and procedures which can highlight the particular wait events where your database is spending the most time.
- Oracle- look at the dynamic performance views known as
V$views orGV$view for Oracle RAC. For exampleV$SQL,V$SESSION,V$EVENT_NAME,V$SESSION_EVENT,V$SESSION_WAIT - SQL Server - look at the diagnostic management views known as DMVs. For example
sys.dm_exec_cached_plans,sys.dm_exec_sessions,sys.dm_exec_sql_text,sys.dm_os_wait_stats. - MySQL & MariaDB - look at objects in the
performance_schemadatabase. For exampleevents_statements_currentandevents_statements_summary_by_digest - PostgreSQL - look at the
PG_STAT_tables. For examplepg_stat_activity,pg_stat_statementsandpg_stat_database. - CockroachDB - run
SHOW CLUSTER QUERIES;will show the queries executing across the whole cluster orSHOW LOCAL QUERIES;for just those on the current node. - IBM Db2 - has several
MON_function tables to view performance such asTABLE(SYSPROC.MON_GET_ACTIVITY(NULL, -2))which will show the sessions that are active and their state and type of activity they are running.
Which wait events should I focus on?
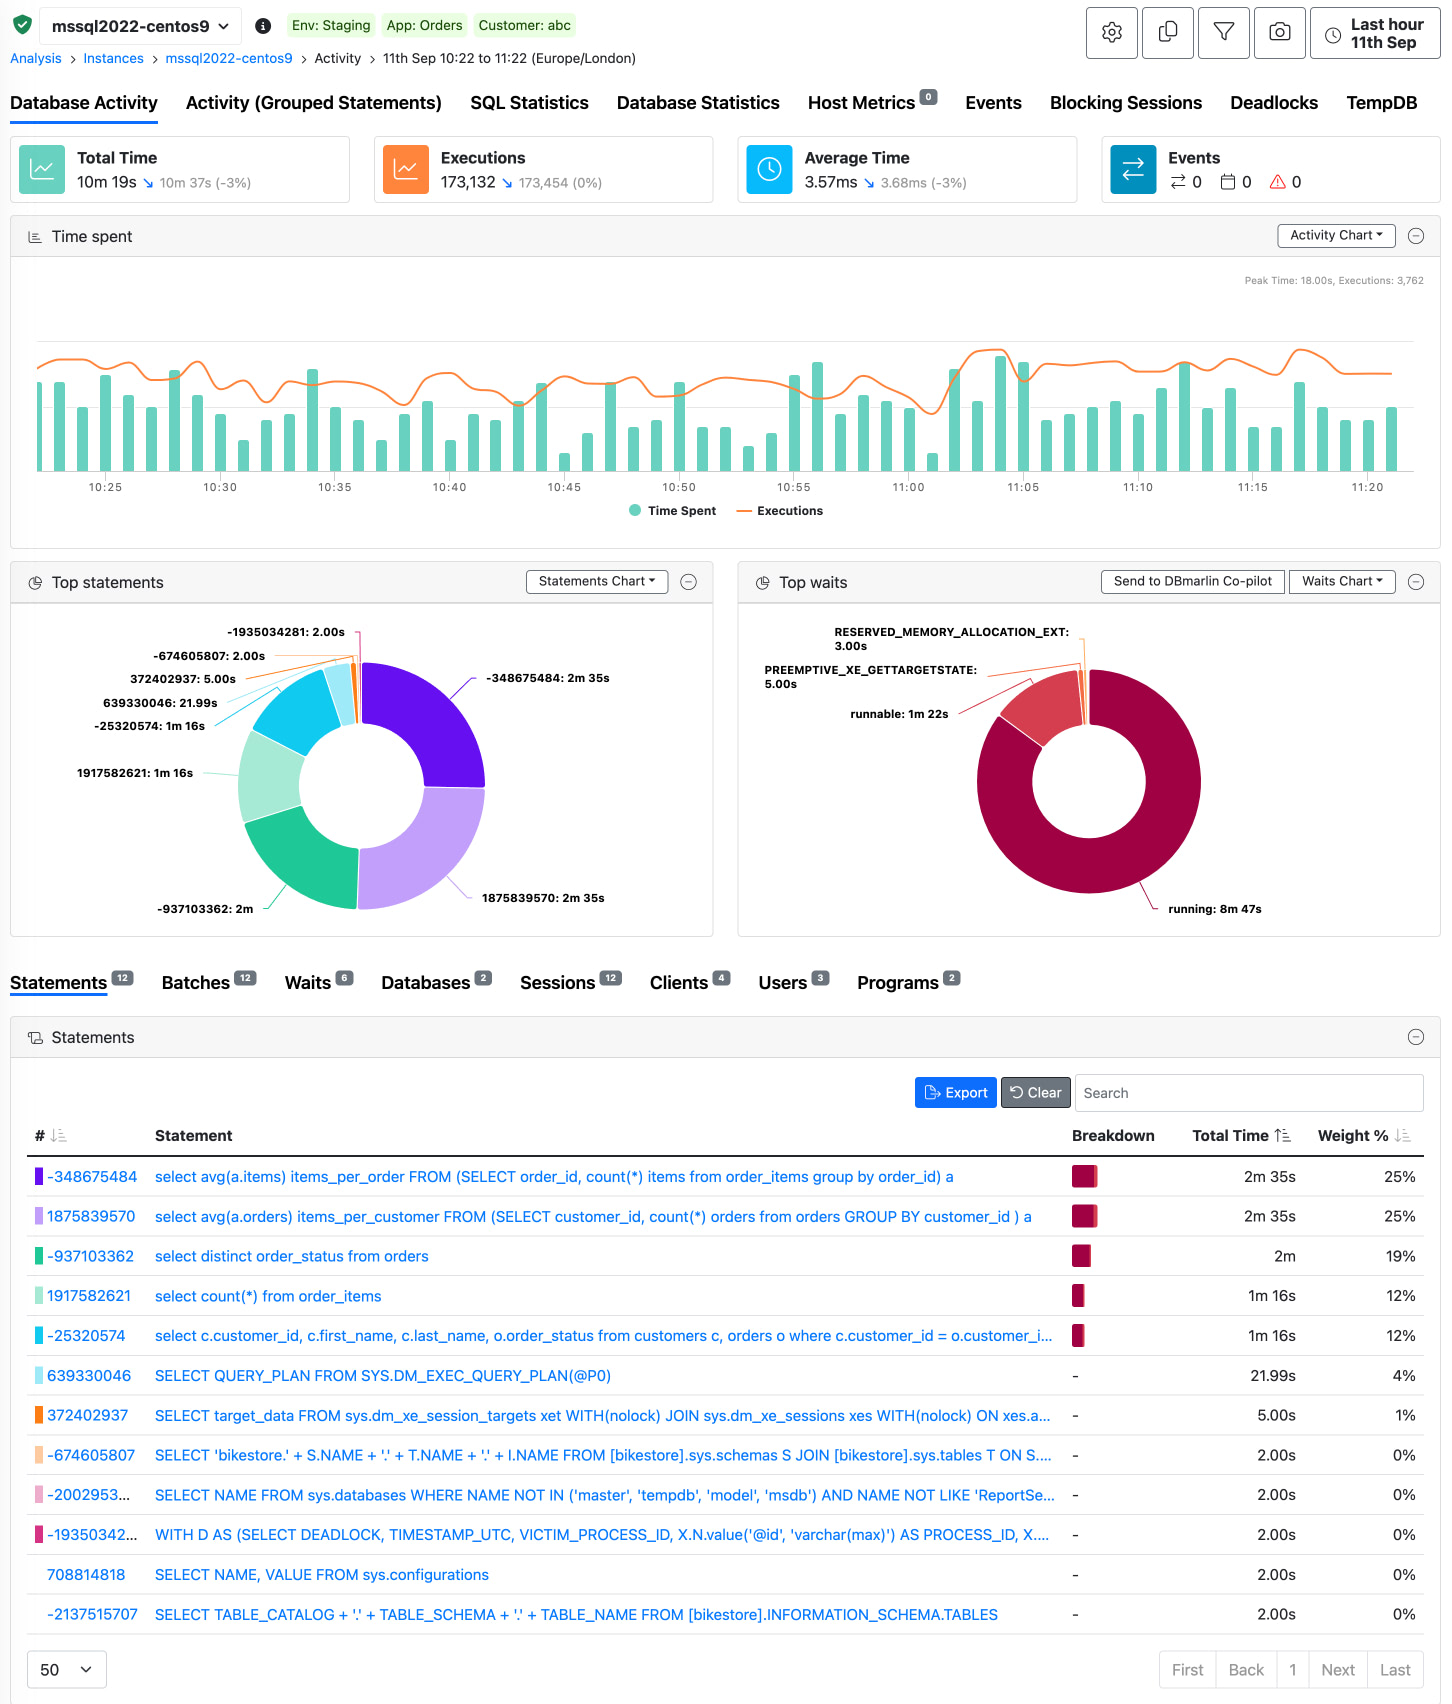
You can use some of the internal performance tables and views as described above to see which wait event have the largest impact on database performance. Alternatively, we would suggest that you use a tool which can collect these for you and present them graphically.
DBmarlin is able to display a breakdown of wait events and present them as an over-time chart. Furthermore, you can use the drill down capability to see which SQL, Programs, Session, Users are waiting and what can be done to reduce the wait time.