AWS RDS
Pre-requisites
Check that the host you want to monitor is a supported host type.
DBmarlin supports monitoring of AWS RDS host metrics via the CloudWatch API.
Adding the Host Target
This is done through the User Interface using the Add Host screen
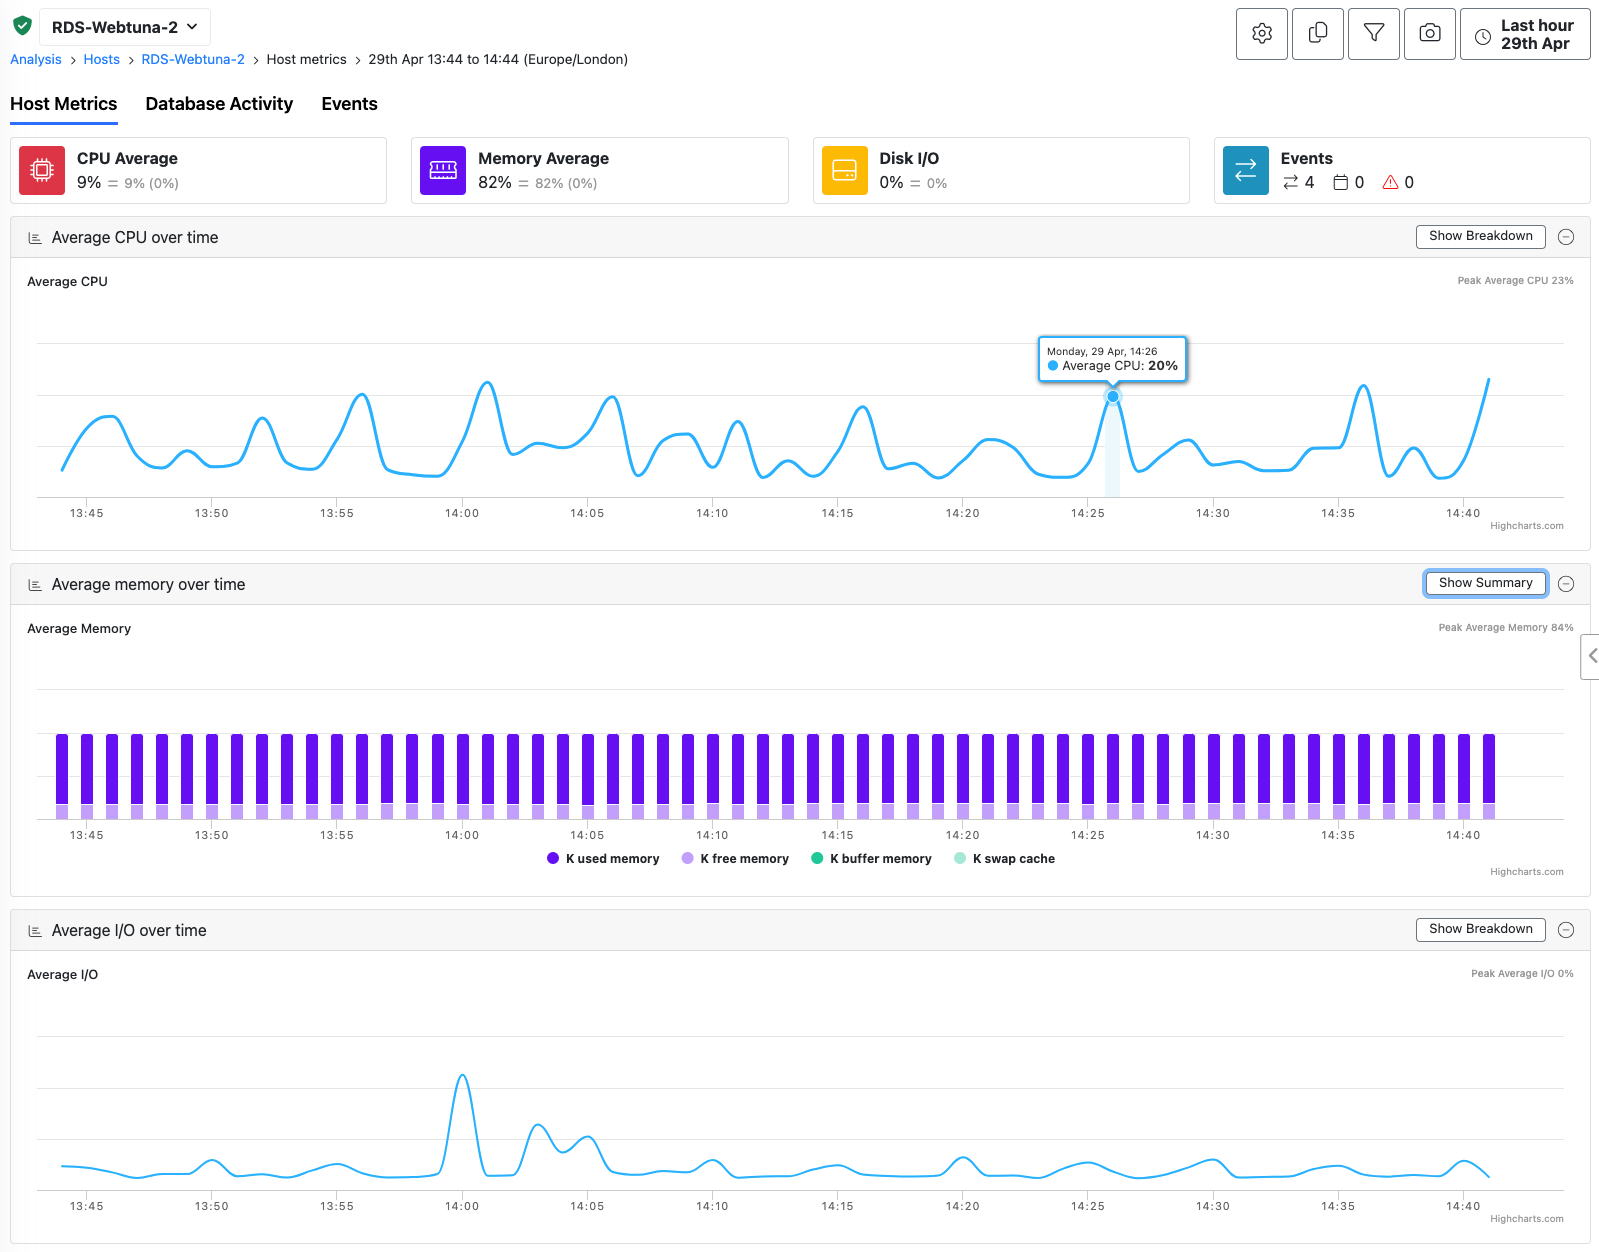
AWS RDS host metrics
The metrics available related to CPU, Disk and Memory like with Linux and Windows host monitoring.
For ease of comparing across different technologies we use standard terms such as
Average CPUwhich is consistent with our Windows and Linux host monitoring. This is instead of using the raw names from CloudWatch which would beCPUUtilizationin this case.
For each of the charts you can use the 'Show Breakdown' button in the top right of the chart to show more metrics. Note that for AWS some of the metrics are not relevant and will show no data.
IAM user permissions
You will need an IAM user with AmazonRDSReadOnlyAccess, AmazonEC2ReadOnlyAccess and CloudWatchReadOnlyAccess
Step 1: Log into the AWS Management Console
Log into your AWS Management Console and navigate to the IAM (Identity and Access Management) dashboard.
Step 2: Create the New IAM User
- Go to Users: In the IAM dashboard, select “Users” from the sidebar.
- Add User: Click on the “Add user” button.
- User Details:
- For user name, enter dbmarlin (or another name if you prefer)
Step 3: Attach Policies for Read-Only Access
- Set Permissions: Click on “Attach existing policies directly.”
- Search and Attach Policies:
- Search for AmazonRDSReadOnlyAccess and select it. This grants read-only access to Amazon RDS resources.
- Search for AmazonEC2ReadOnlyAccess and select it. This grants read-only access to Amazon EC2 resources.
- Search for CloudWatchReadOnlyAccess and select it. This grants read-only access to CloudWatch metrics. Alternatively, you can create a custom policy that encompasses all the necessary permissions if you need to refine the access further.
Step 4: Review and Create User
- Review the settings and attached policies to make sure everything is correct.
- Click on “Create user.”
Step 5: Collect User Credentials
After the user is created, AWS will provide you with:
- Access key ID and Secret access key for programmatic access. Download and save these credentials securely, as you will not be able to retrieve the secret access key again after this step.
Troubleshooting
- Ensure HTTPS (Port 443) is open to
cloudwatch.{aws-region}.amazonaws.com. E.g.cloudwatch.us-east-1.amazonaws.com - Ensure HTTPS (Port 443) is open to
rds.{aws-region}.amazonaws.com. E.g.rds.us-east-1.amazonaws.com - Test connectivity using AWS CLI which you can and install it from AWS's official site. Note that AWS CLI isn't required to use DBmarlin AWS monitoring but can be helpful for troubleshooting connectivity. Configure the CLI with your credentials and default region using
aws configure. and then try to retrieve theCPUUtilizationmetric for an RDS instance namedmy-rds-instanceover the past hour, with data points every 5 minutes (300 seconds), showing the average like this:
aws cloudwatch get-metric-statistics --namespace "AWS/RDS" --metric-name CPUUtilization \
    --dimensions Name=DBInstanceIdentifier,Value=my-rds-instance \
    --start-time $(date -u -d '1 hour ago' +'%Y-%m-%dT%H:%M:%SZ') \
    --end-time $(date -u +'%Y-%m-%dT%H:%M:%SZ') \
    --period 300 --statistics Average