Clusters
New in DBmarlin 6.9.0. Currently SQL Server only.
The Clusters screen shows each high-availability cluster that your monitored database instances belong to, all in one place. You can see straight away whether every cluster is healthy, which availability groups and nodes each one contains, and what has changed recently.
In 6.9.0 the Clusters screen supports SQL Server Always On availability groups that run on a Windows Server Failover Cluster (WSFC). For a group-level view of replicas, databases and data movement, see SQL Server Always On Availability Groups.
Getting started
You don't need to set anything up. DBmarlin finds clusters automatically:
- Add your SQL Server instances to DBmarlin as usual.
- When an instance hosts a replica of an Always On availability group, DBmarlin reads the cluster, availability group, replica, listener and node details from it.
- Within a few minutes the cluster appears under Analysis → Clusters in the side menu.
The Clusters menu item appears when your DBmarlin installation supports a database type that has clusters (currently SQL Server). The badge next to it shows how many clusters have been found.
DBmarlin can work out the whole availability group from just one monitored instance. Even so, we recommend adding every replica as a DBmarlin instance:
- Cluster information stays current even if one replica becomes unreachable.
- Log send and redo rates are measured on each replica rather than taken from the last figure SQL Server reported.
- Every replica links through to its own Activity screen.
Only availability groups that run on a Windows Server Failover Cluster are shown. Read-scale availability groups created with CLUSTER_TYPE = NONE have no cluster to show, so they don't appear on this screen.
Clusters list
Analysis → Clusters lists every monitored cluster.
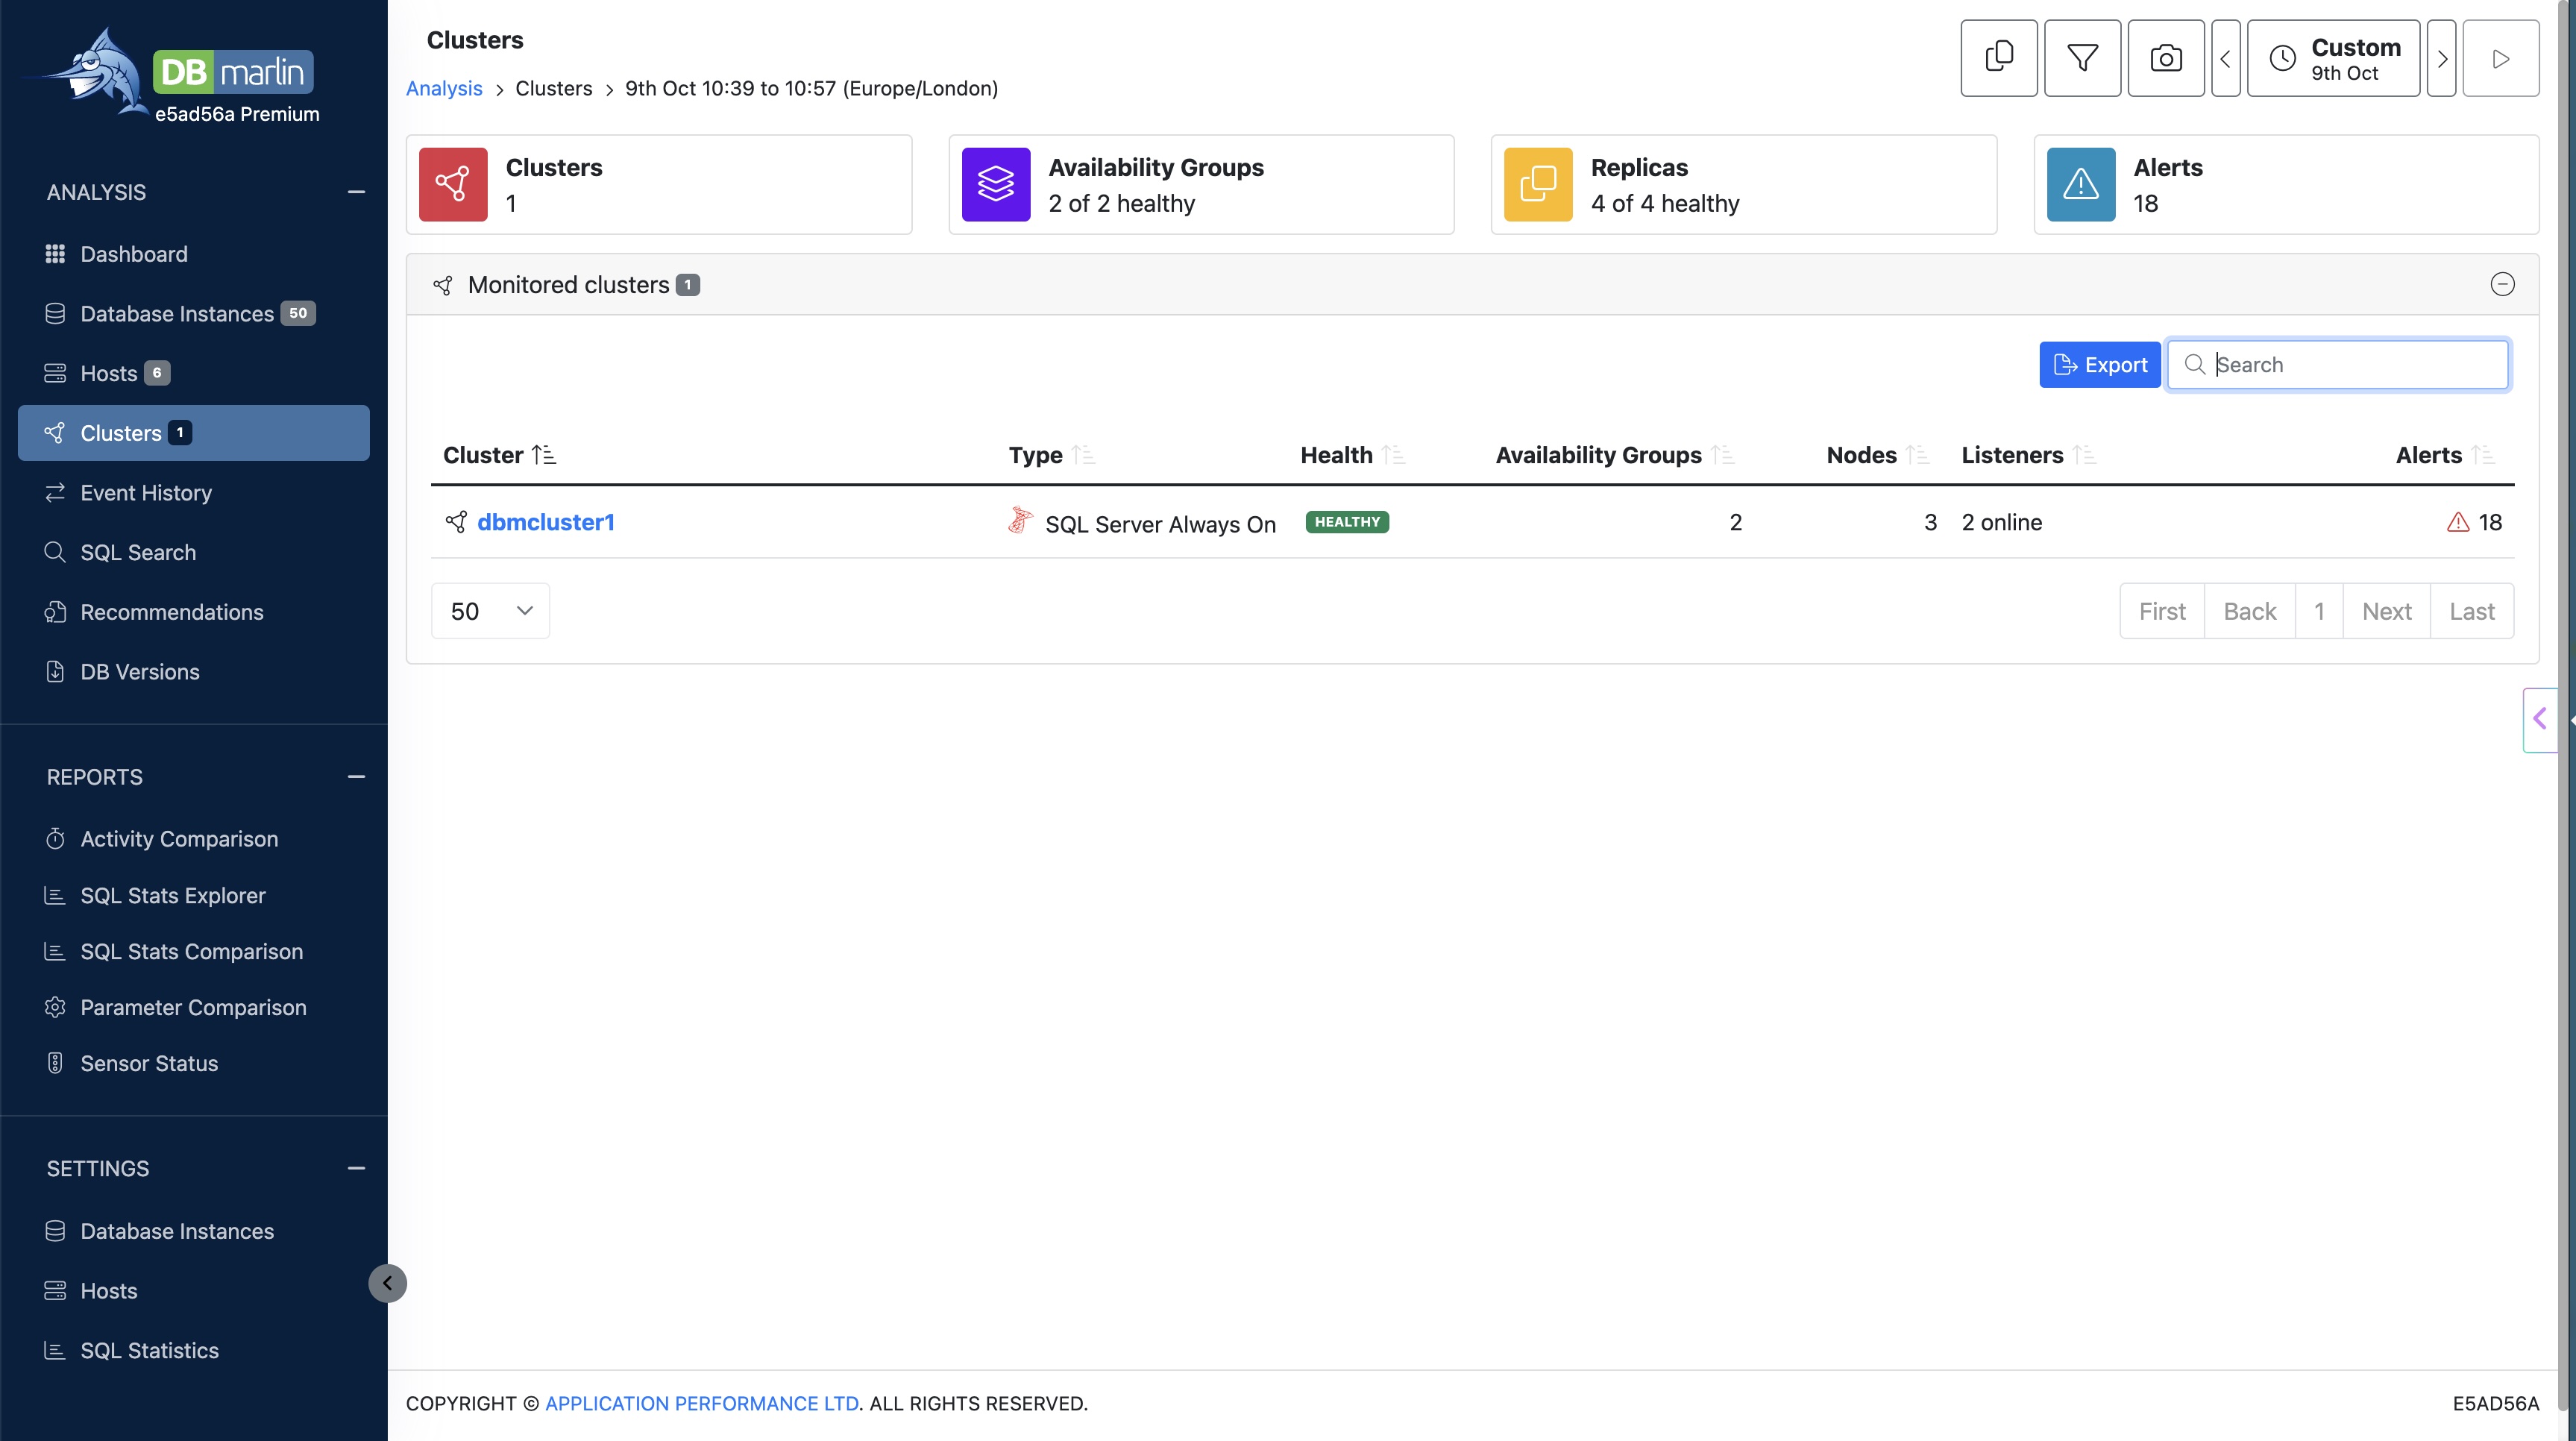
Summary widgets
| Widget | Description |
|---|---|
| Clusters | How many clusters are monitored |
| Availability Groups | How many availability groups are healthy, out of the total (for example 3 of 4 healthy) |
| Replicas | How many availability replicas are healthy, out of the total |
| Alerts | How many availability group alerts were raised in the selected time period, across all clusters |
Monitored clusters table
| Column | Description |
|---|---|
| Cluster | The cluster name. Click it to open the cluster overview. |
| Type | The cluster technology, for example SQL Server Always On |
| Health | Overall health of the cluster. It is NOT HEALTHY if any replica or database in any of its availability groups is unhealthy. |
| Availability Groups | How many availability groups the cluster has |
| Nodes | How many nodes the cluster has |
| Listeners | How many listeners are online, or how many are offline (for example 1 of 2 offline) |
| Alerts | How many alerts were raised in the selected period. The warning icon takes the colour of the most severe alert still raised. |
As on other DBmarlin list screens, you can search the table, sort it by any column and export it to CSV.
Cluster overview
Click a cluster name to open its overview. The breadcrumb takes you back to the list, and the time range picker sets the period used for events.
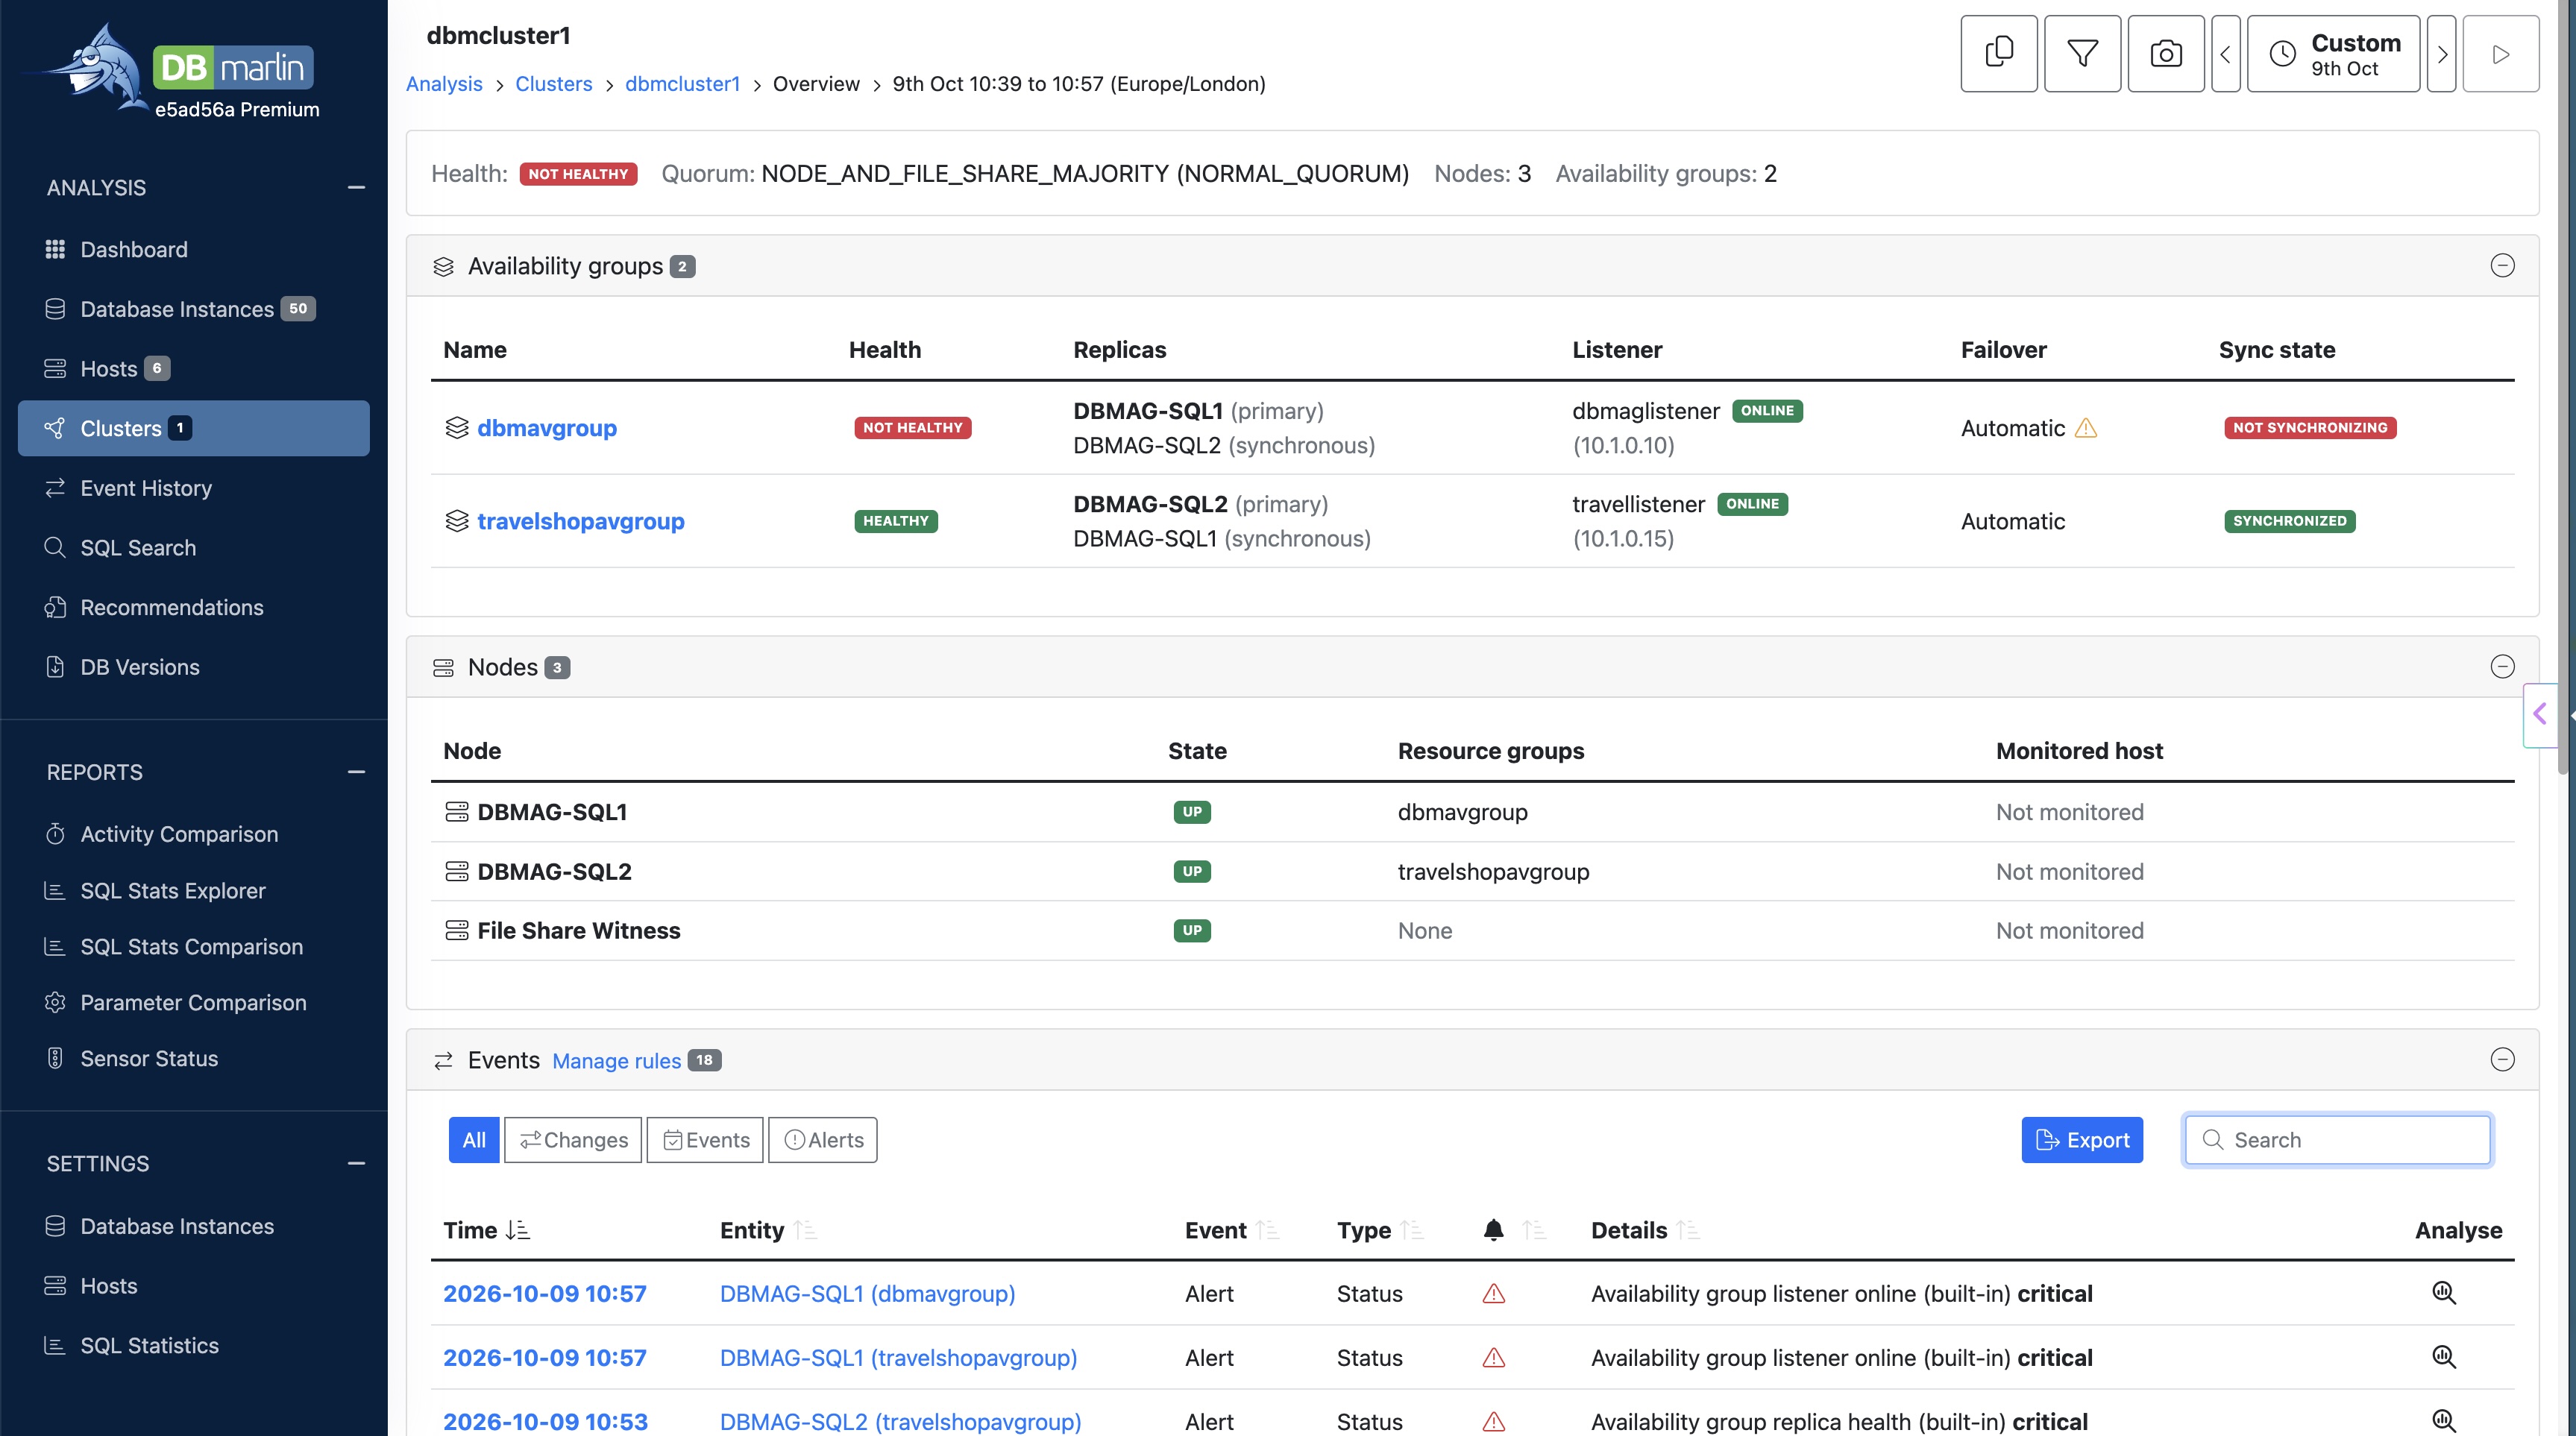
Summary strip
A strip at the top shows:
- Health: the overall health of the cluster
- Quorum: the quorum type and its current state, for example
NODE_AND_FILE_SHARE_MAJORITY (NORMAL_QUORUM) - Nodes: how many nodes the cluster has
- Availability groups: how many availability groups the cluster hosts
Availability groups
There is one row for each availability group in the cluster:
| Column | Description |
|---|---|
| Name | The availability group name. Click it to open the availability group screen. |
| Health | HEALTHY or NOT HEALTHY, rolled up from the group's replicas and databases |
| Replicas | Each replica server. The primary is shown in bold; each secondary is marked synchronous or asynchronous. |
| Listener | The listener's DNS name, its state and its IP addresses, or None |
| Failover | Automatic or Manual. A warning icon means the group is not ready for automatic failover. |
| Sync state | SYNCHRONIZED when every secondary is synchronized. Otherwise NOT SYNCHRONIZING. |
Nodes
There is one row for each Windows Server Failover Cluster node:
| Column | Description |
|---|---|
| Node | The node's name |
| State | The node's cluster membership state, for example UP |
| Resource groups | The cluster resource groups that are on this node |
| Monitored host | A link to the node on the DBmarlin Hosts screen if you also monitor it as a host. Otherwise Not monitored. |
Events
The Events table lists everything that happened across the cluster in the selected time period:
- availability group failovers
- health changes
- alerts raised and recovered
Its columns are the same as on the Event History screen. Use the Manage rules link to go to the alert rules that cover availability groups (see Alerts).
Status colours
The same colours are used for health and state badges throughout the Clusters screens:
| Colour | Meaning | Examples |
|---|---|---|
| Green | Healthy | HEALTHY, ONLINE, SYNCHRONIZED, CONNECTED, UP |
| Amber | Degraded or in transition | PARTIALLY HEALTHY, SYNCHRONIZING, RESOLVING |
| Red | Fault | NOT HEALTHY, OFFLINE, DISCONNECTED, NOT SYNCHRONIZING |
| Grey | Unknown: no recent data | UNKNOWN |
UNKNOWN means that none of the group's replicas has sent DBmarlin any data for the last few minutes, for example because DBmarlin can't connect to any of them. DBmarlin then shows the state as unknown, not the last state it saw, so that old data is never mistaken for the current state.
Where else clusters appear
Availability group membership also appears on other DBmarlin screens:
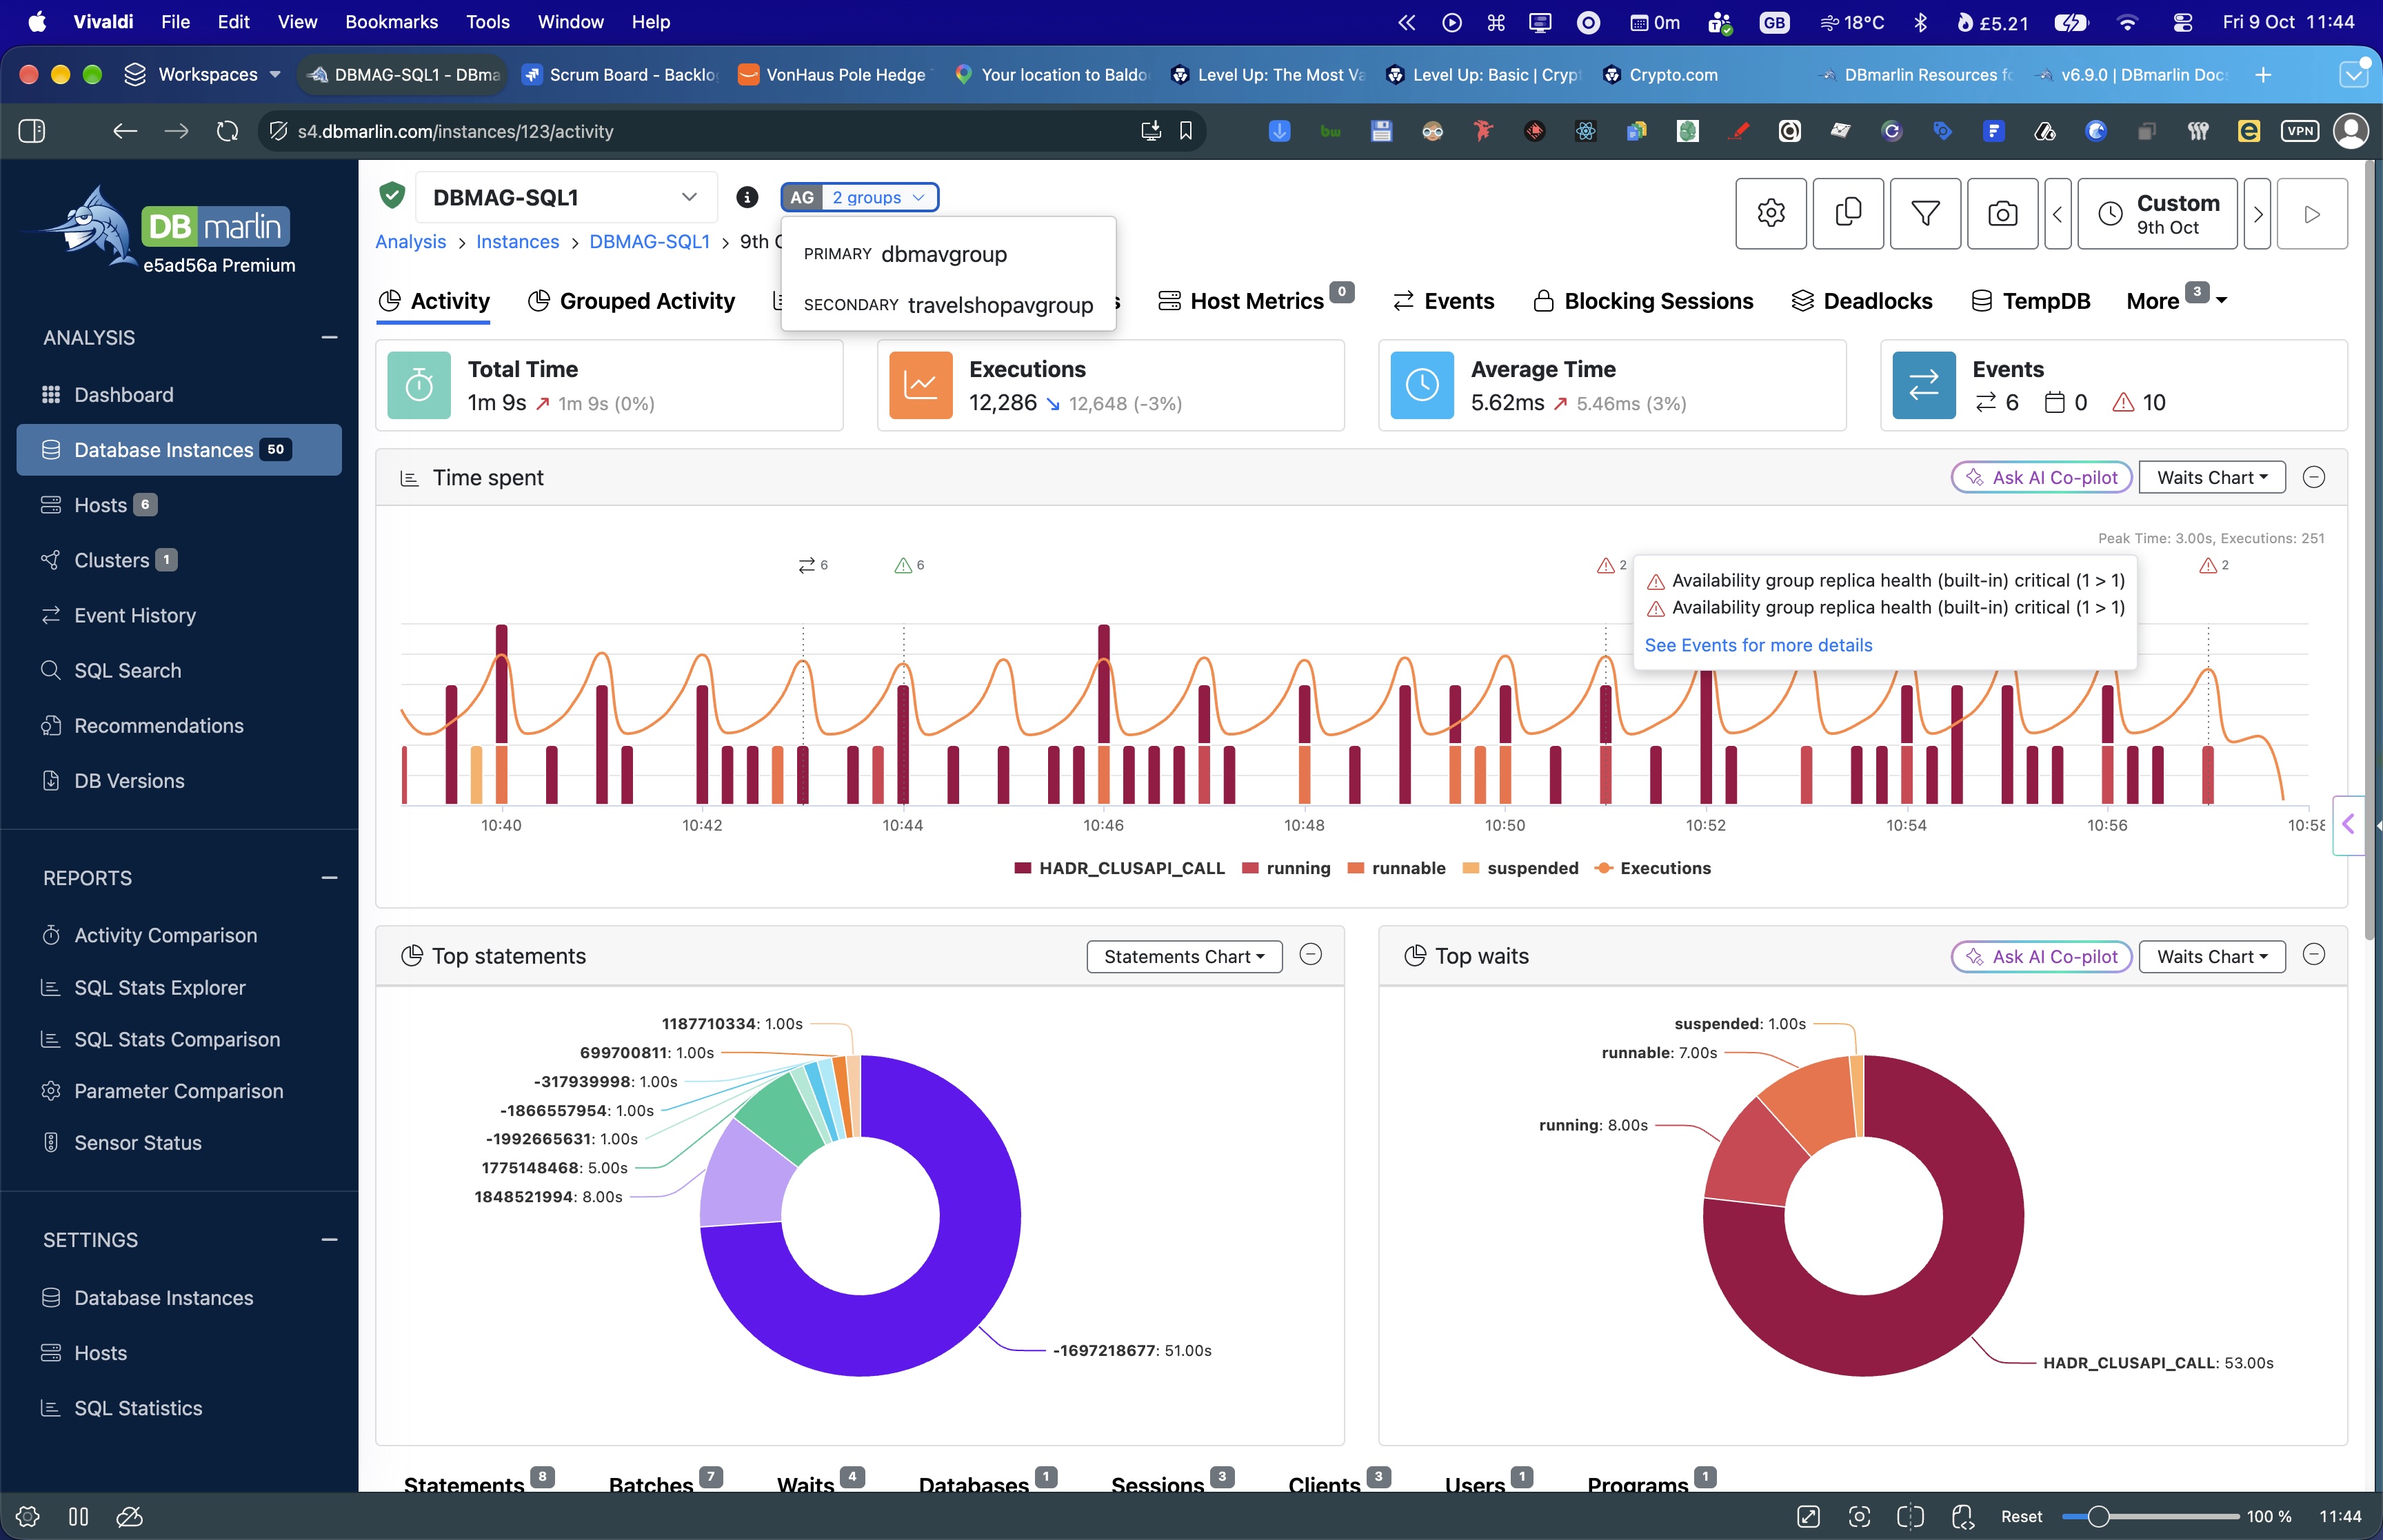
- Instance screens: the header of a SQL Server instance that hosts a replica shows a badge with its availability group name and its role (
PRIMARYorSECONDARY). Click the badge to open the availability group screen. If the instance hosts replicas of more than one group, the badge opens a menu of those groups. - Dashboard: instance tiles show a compact version of the badge, with P for primary or R for secondary replica.