Common UI features
Here are some explanations for some common features seen throughout various screens within the DBmarlin user interface.
Header Section

Breadcrumbs
The breadcrumbs allows you to navigate back to the previous screens as you drill down. You can also use the 'Back button' on your browser.
Date selector
The date selector allows you to choose either relative or absolute dates and times. Once selected the same time range is maintained as you navigate from one screen to the next.
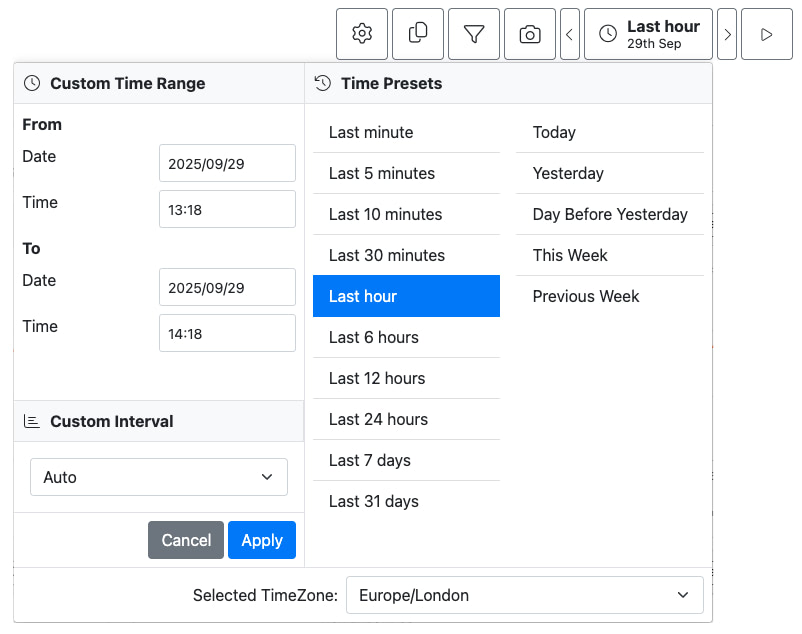
Date nudge
Using the arrows either side of the date control allow you to nudge the time-range backwards or forwards. Ihe time-ranges shifts forwards or backwards by 50% of the selected period. For example if you are viewing 1 hour of data, then you can nudge back or forward by 30 minutes. Or if you are viewing a 10 minute period then it would nudge by 5 minutes.
Auto-refresh
The auto-refresh button is to the right of the date selector. You can click the button to enable auto-refresh if your currently selected period is any of the following:
- Last minute
- Last 5 minutes
- Last 10 minutes
- Last 30 minutes
- Last hour
Click the button to activate auto-refresh which turns the button green. Click the button again to turn off auto-refresh. Auto-refresh will also be disabled if you change screens. The auto-refresh interval is 10 seconds after which you should see new data arrive.
Chart zoom
You can also drag a band around a period on a chart to zoom to that period. This updates the time range globally, the same as if it were done via the Date selector.
Custom Interval
The date selector also has the option to set a "Custom Interval" to change the granularity of the charts. The default is "Auto" which will attempt to display a sensible number of data points per chart taking into account the performance and legibility of the charts.
For example, with a 1 hour period, Auto will return 60x 1-minute data points but using the custom interval, you could override this and ask for the data in 15-second intervals. The custom interval is remembered until you make changes within the date selector after which it will revert to "Auto".
Note that selecting an interval smaller than the frequency at which the data is collected could cause strange results. For example setting a 1 second interval for statistics which are only collected every minute.
Selected TimeZone
The date selector offers the option to choose between your local time zone, determined by your browser/OS settings, or UTC (Coordinated Universal Time). UTC is commonly used on servers because it doesn't adjust for daylight savings like other time zones. Viewing DBmarlin data in UTC can be beneficial for aligning timestamps with server-side log messages.
Choose Snapshot
Select a saved snapshot to apply. A snapshot is a named time range (and optionally additional filters) that had been previously saved.
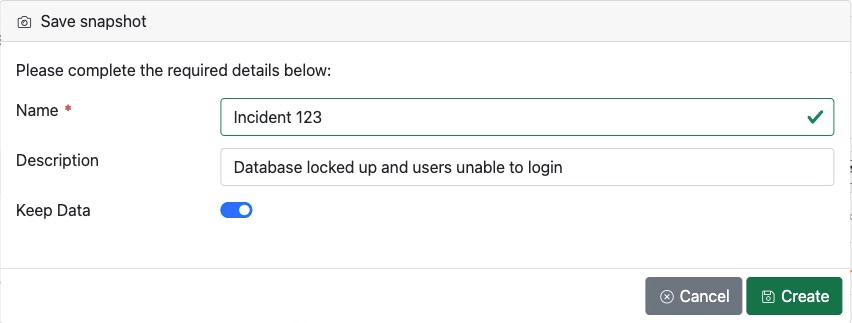
Save Snapshot
Save the current time range and any filters applied as a snapshot so you can easily reapply the same filters again in the future. Clicking the Save Snapshot button will prompt for a Name, Description and a toggle option which allows you to "Keep Data". If you enable "Keep Data" then the data will not be purged after the normal data retention period for per second and per hour data.
There are many use cases for saved Snapshots including:
- Save a snapshot for an incident - so it can be linked to the Incident record for future reference
- Save a snapshot for a peak trading period such as Black Friday
- Save a snapshot for a load test - so that it can be compared to a different load test
- Save a snapshot for any period of time you need to keep a high granularity beyond the retention period.
Saved snapshots can be recalled from the Choose Snapshot dropdown or used for period selection in the Time Comparison Report
Saved snapshots can be deleted once they are no longer needed from the Snapshot Settings screen.
Copy link
The copy link button allows you to copy a deep link URL to the current screen and time selection so that it can be shared with others. For example you could email, instant message or attach the URL in a support ticket and others clicking on the link will get to exactly the same view as you.
If you have a relative time period such as Last hour selected then the copied link will be a fixed time period of 1 hour from the time at which the button was clicked. This means the data could differ slightly from the screen you are looking at if there is a delay between refreshing the screen data and clicking the Copy link button.
Content Section
Collapsing widget panels
For any widget panel which has a minus sign in the top right hand corner it is possible to collapse the panel or expand it by clicking anywhere in the widget header. This is useful if you want to minimise certain widgets for example.
Zoom on charts
You can drag your mouse around a part of the chart to zoom in on that part. To get back to the orginal time range click the 'Reset zoom' button in top right of the chart.
Tables
Search within table data
The Search box lets you search within the table data including all visible field and also some hidden field such as Database Type which might not be visible in the table. To clear the search you can either delete the text from the Search box or click the Clear button.
Table Exporting data
The Export button at the top of the table allows exporting of table data to CSV format which can then be opened in Excel.
Table pagination
The tables by default show the top 10 records. You can use the dropdown below the table to show 20, 30 or all rows.
Table limits
The tables by default show only the top 500 records for performance reasons. If you hit the limit a banner will show warning that the number of rows is greater than 500.