Host Dashboard
Host tabs
The tabs at the top of the screen let you switch between Host Metrics, Database Activity or Events.
- Host Metrics
- See the host performance metrics.
- Database Activity
- See metrics for any instances mapped to the host. You can also click through to the instance to jump across to look at database instance performance.
- Events
- See events related to the host such as Alerts.
KPI Widgets
The key performance indicators at the top of the screen are there to show top level metrics.

- CPU Average - This is the average amount of CPU utilised within the selected period.
- Memory Average - This is the average amount of memory utilised within the selected period.
- Disk I/O - This is the average amount of Disk I/O utilised within the selected period.
- Changes - This is the number of changes or custom events within the selected period.
Summary charts
The host dashboard screen gives a performance overview of the key host metrics such as CPU, Memory and disk I/O and disk utilisation.
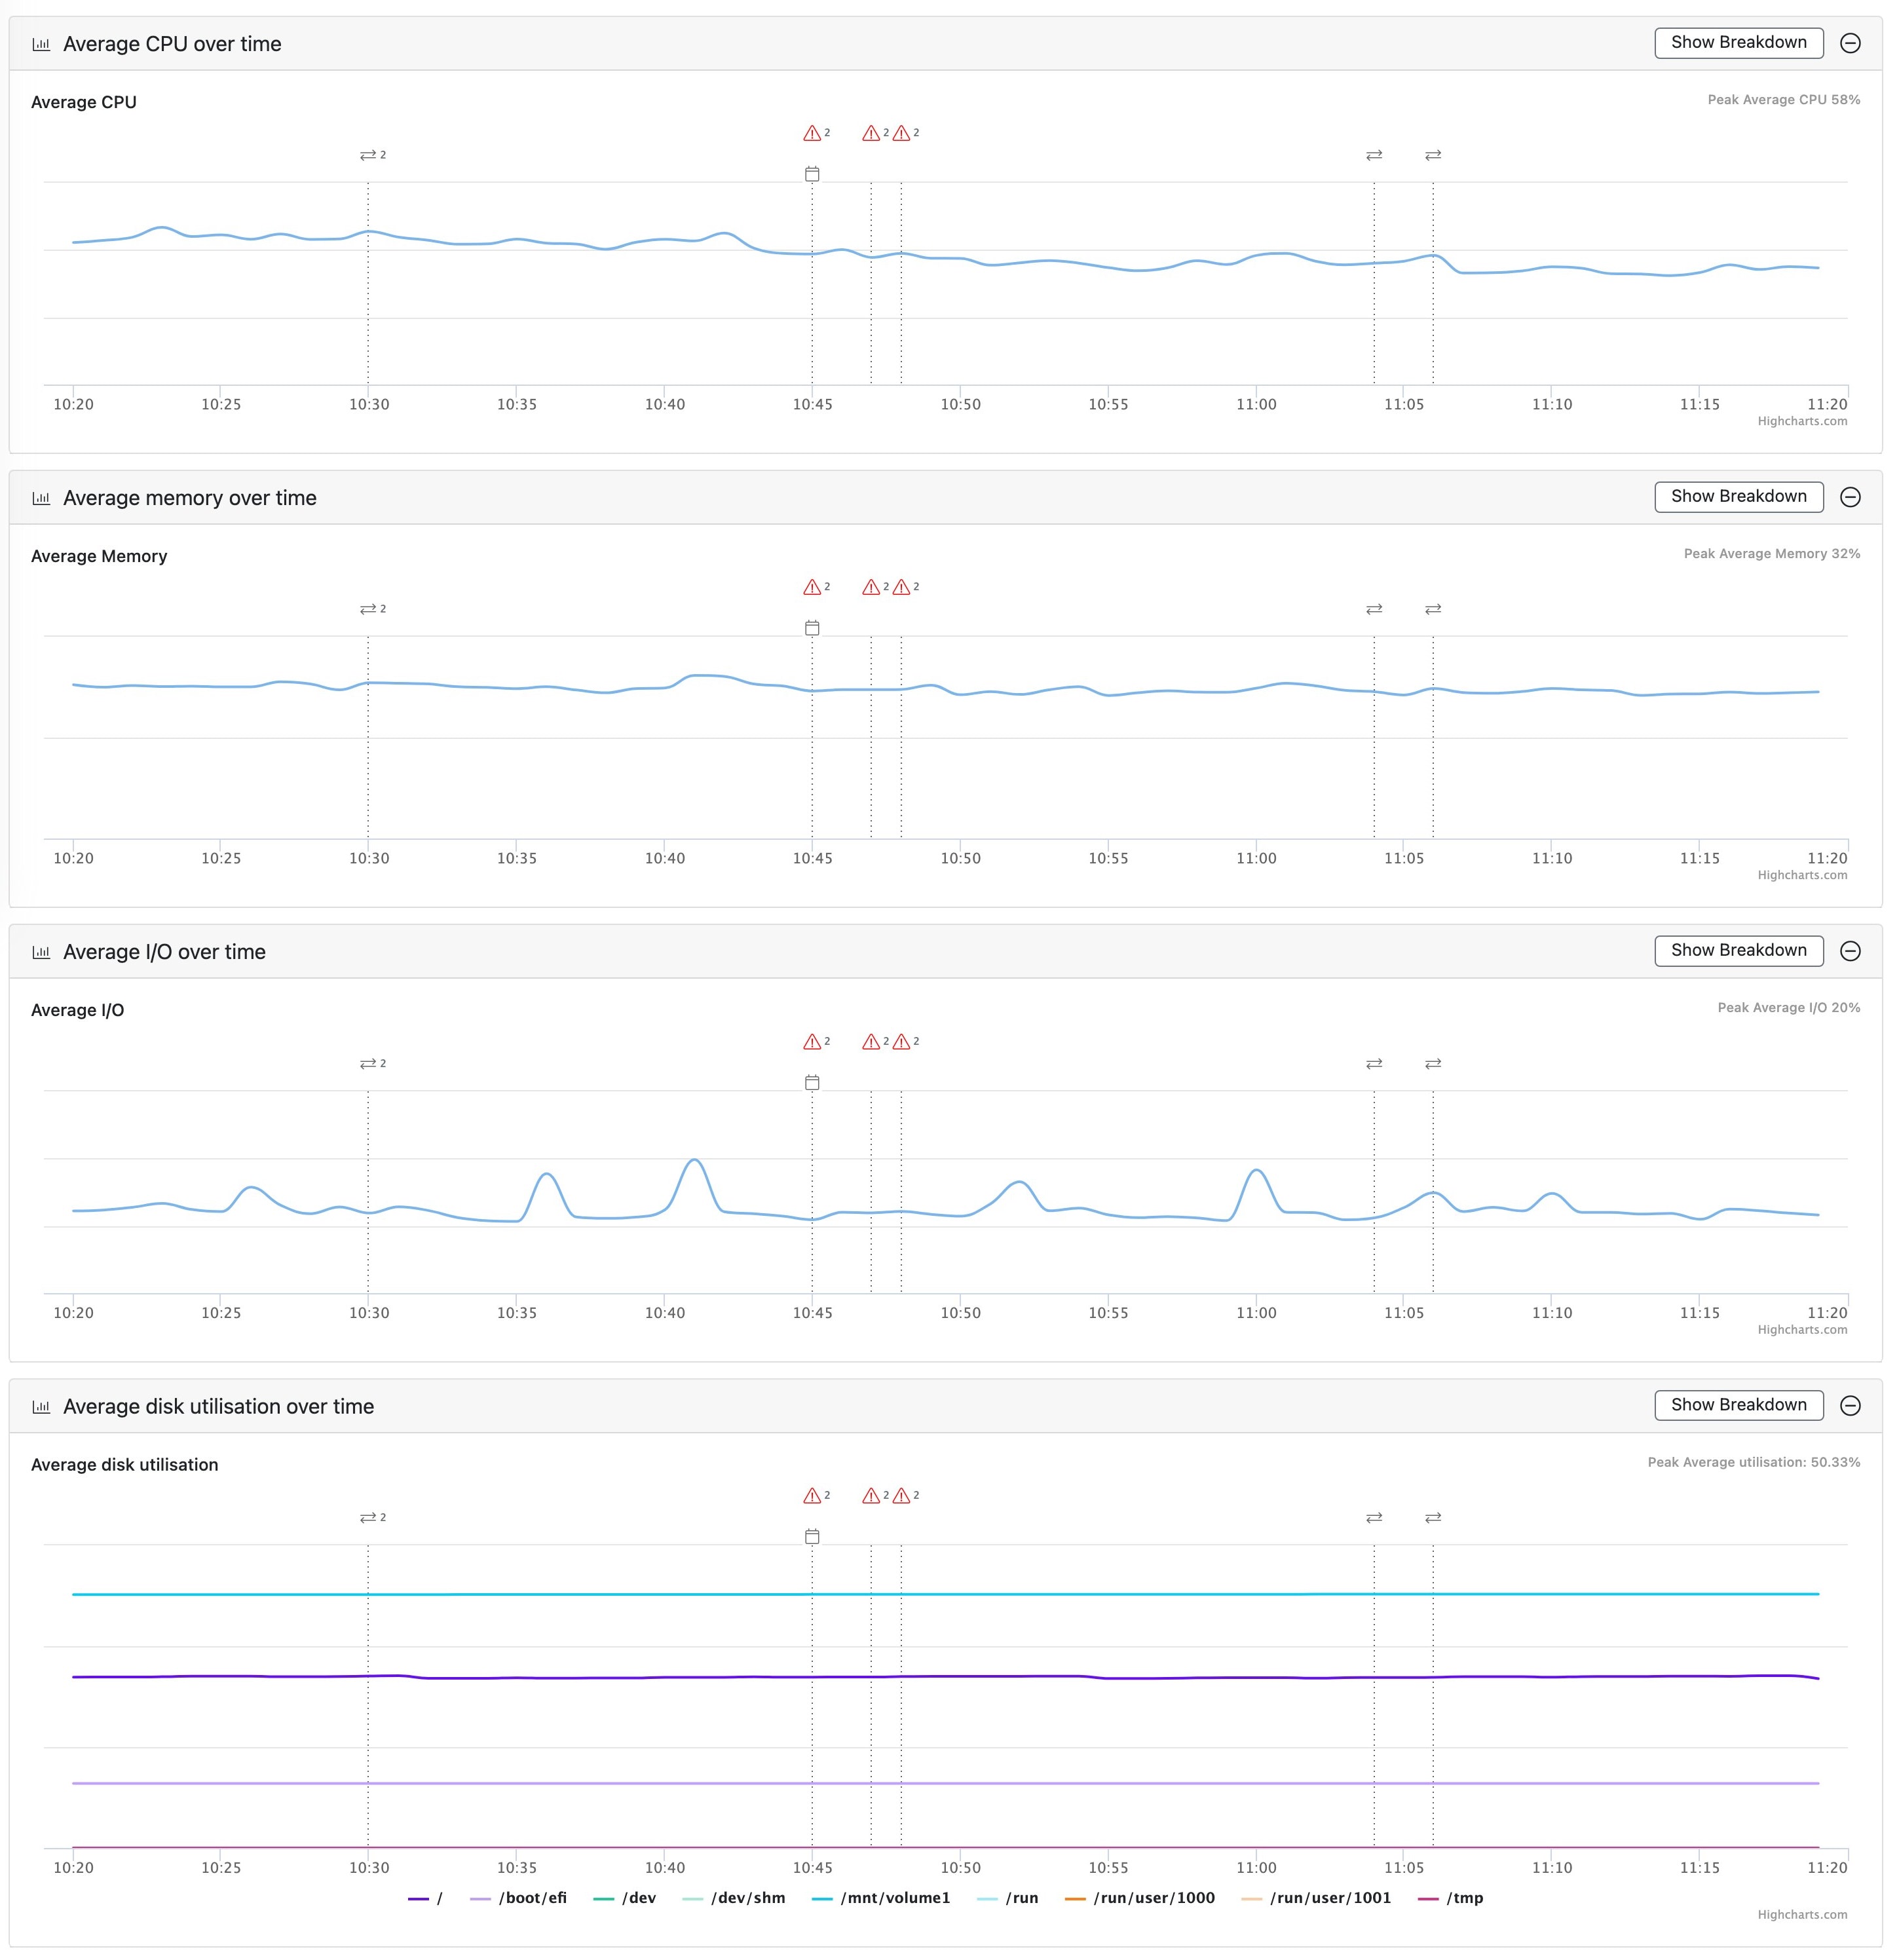
Breakdown charts
By clicking the 'Show Breakdown' button in the top of each chart you can toggle between the simple view and detailed breakdown of each of the CPU, memory and Disk metrics.
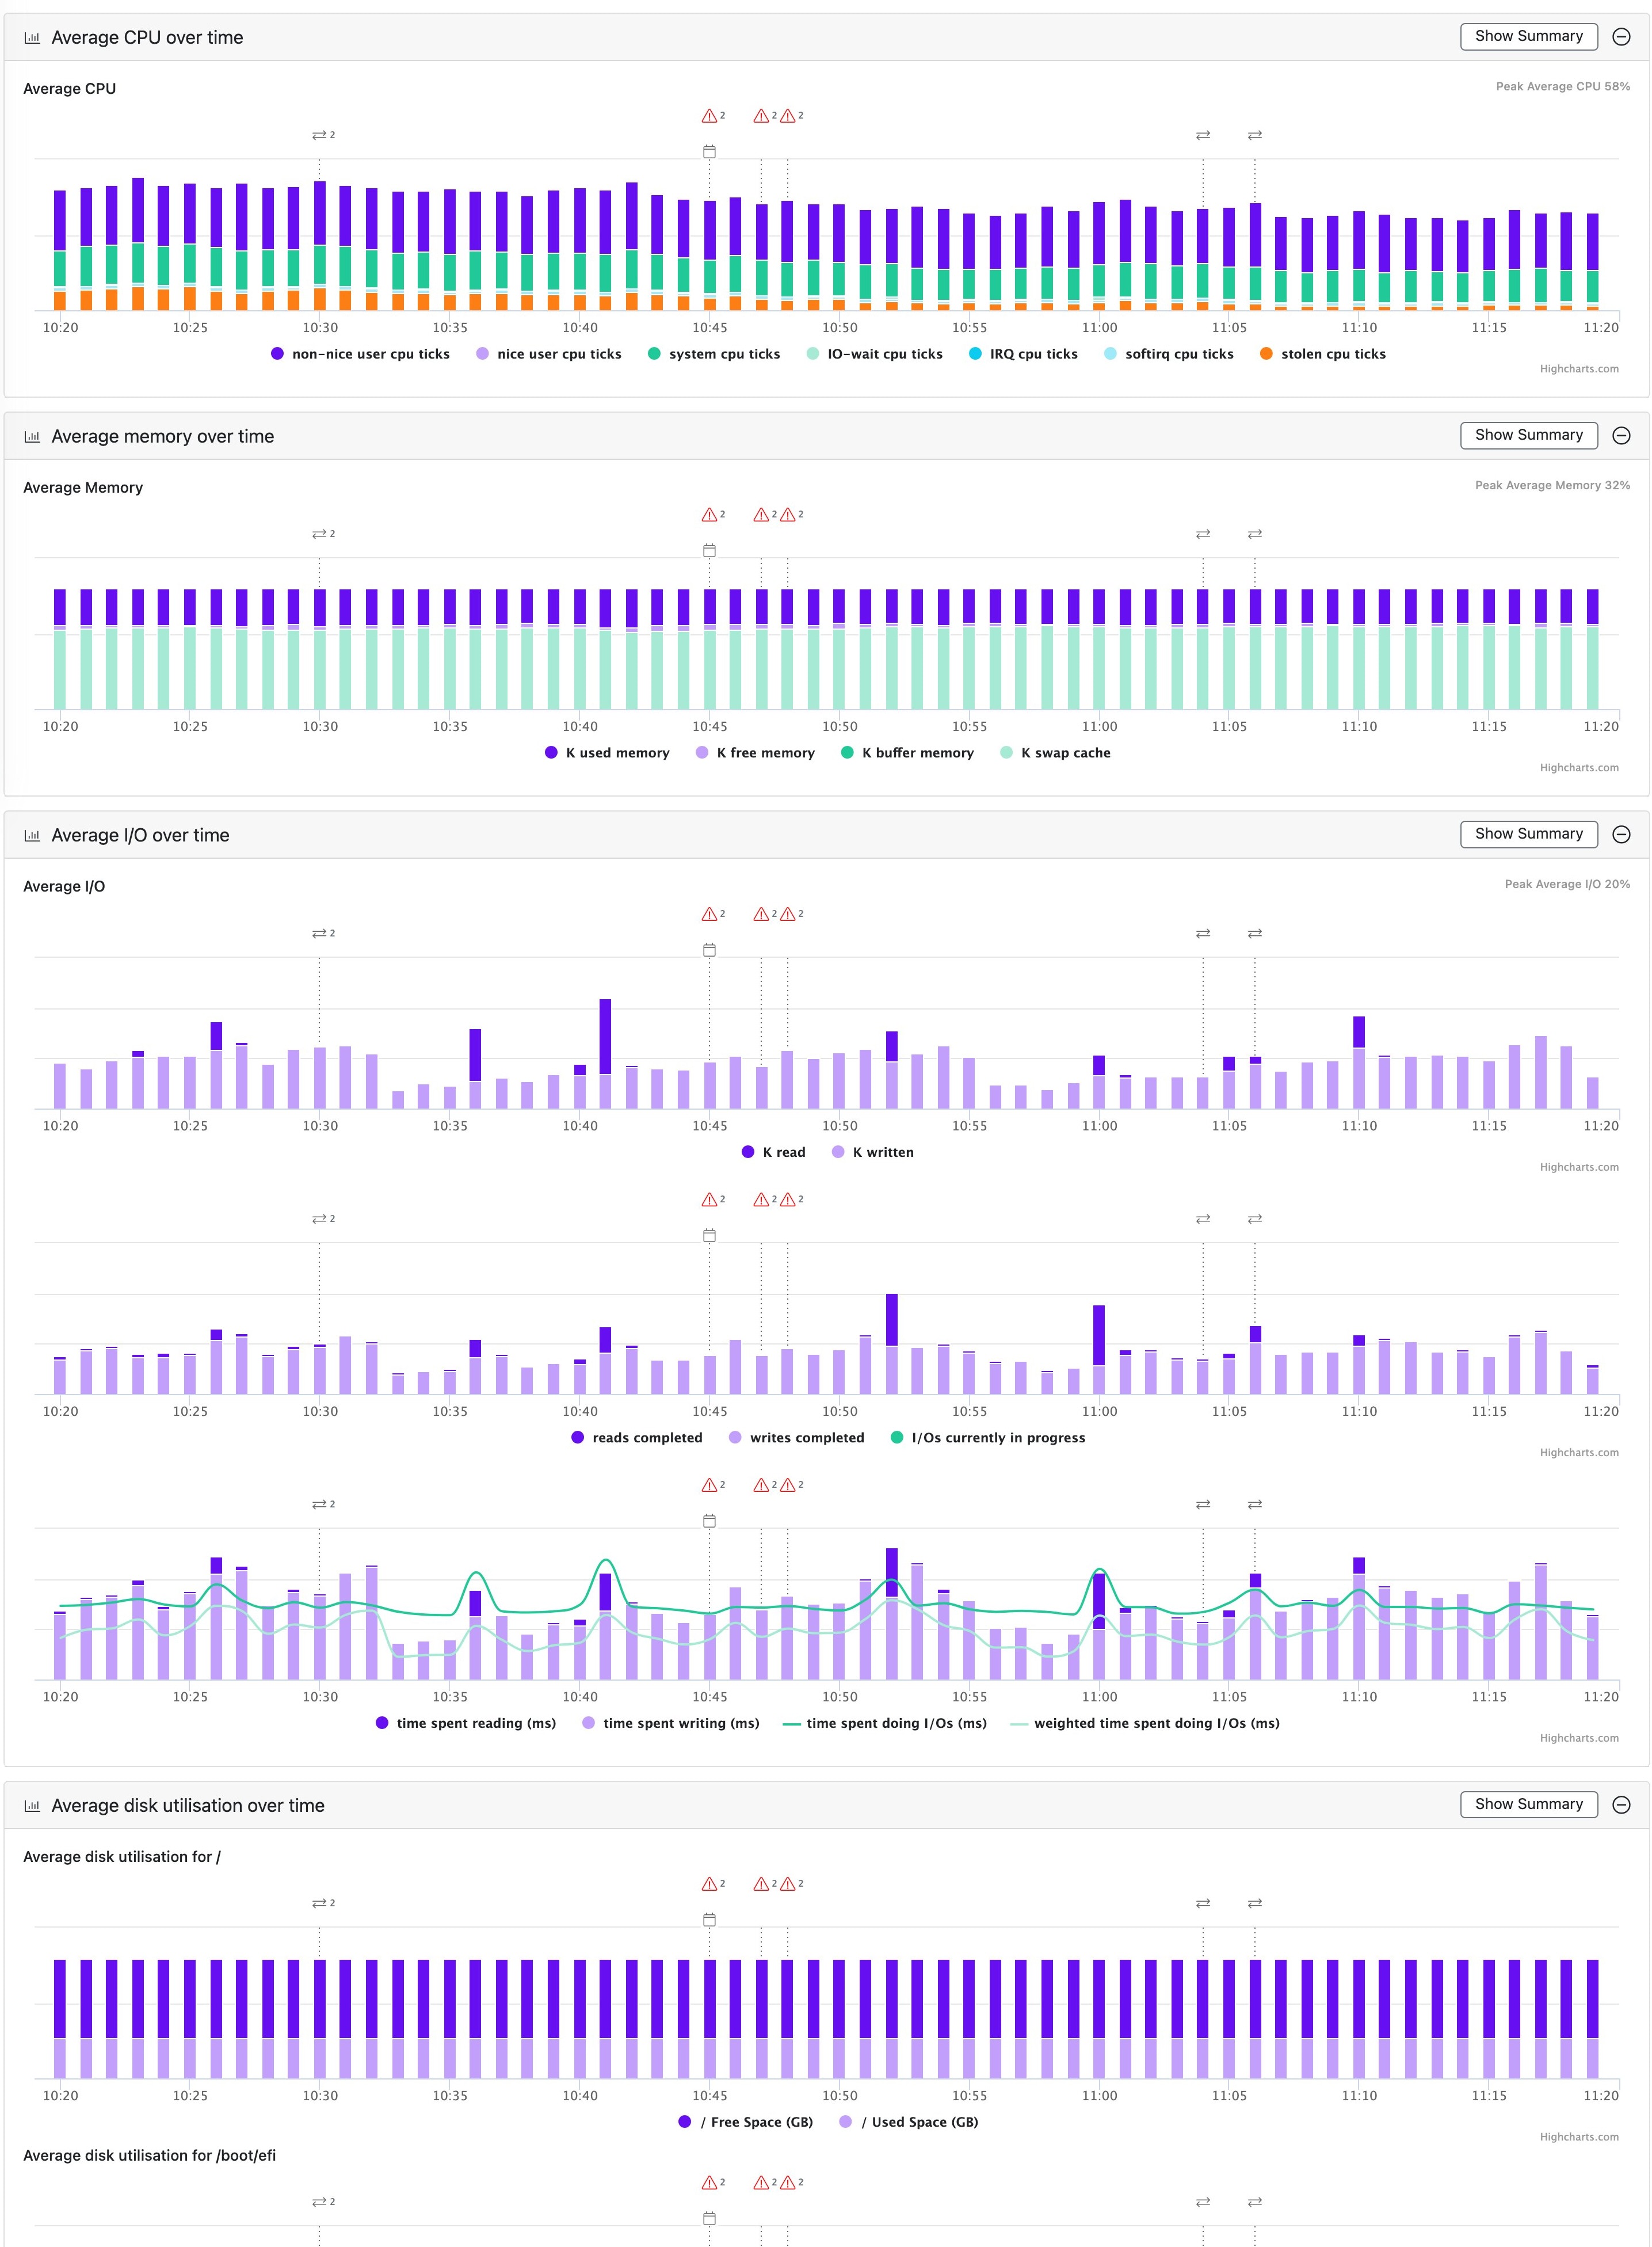
The charts then show stack bars for the following metrics:
- Disk I/O metrics (bytes reads/writes, I/Os completed reads/writes, time spent doing I/O ms reads/writes)
- Disk utilisation metrics (free and used space (GB) per disk volume). Unlike the other host metrics, disk utilisation is collected at the batch interval rather than the default monitoring interval as disk space doesn't need to be monitored every second.
- CPU metrics (nice, non-nice, system, I/O wait, IRQ, SoftIRQ and stolen time)
- Memory metrics (used, active, inactive, free, buffer, swap cache and swap free)