Self-monitoring
New in DBmarlin 6.10.0. The Self Monitoring screen is only available to admin users.
The Self Monitoring screen shows the health of DBmarlin itself, so you can check and troubleshoot your DBmarlin server from the browser. It has four tabs:
- Overview: health metrics for the DBmarlin archiver and agents, such as memory, CPU, threads, database connections and data ingested.
- Logs: view and search the Tomcat, PostgreSQL and nginx logs.
- Database: the size of the DBmarlin repository database and its largest tables.
- Support: generate and download a support bundle to send to DBmarlin support.
To open it, click Self Monitoring in the Help section of the menu.
To monitor the DBmarlin PostgreSQL repository database as a database instance in DBmarlin, see the Self-monitoring FAQ.
Overview
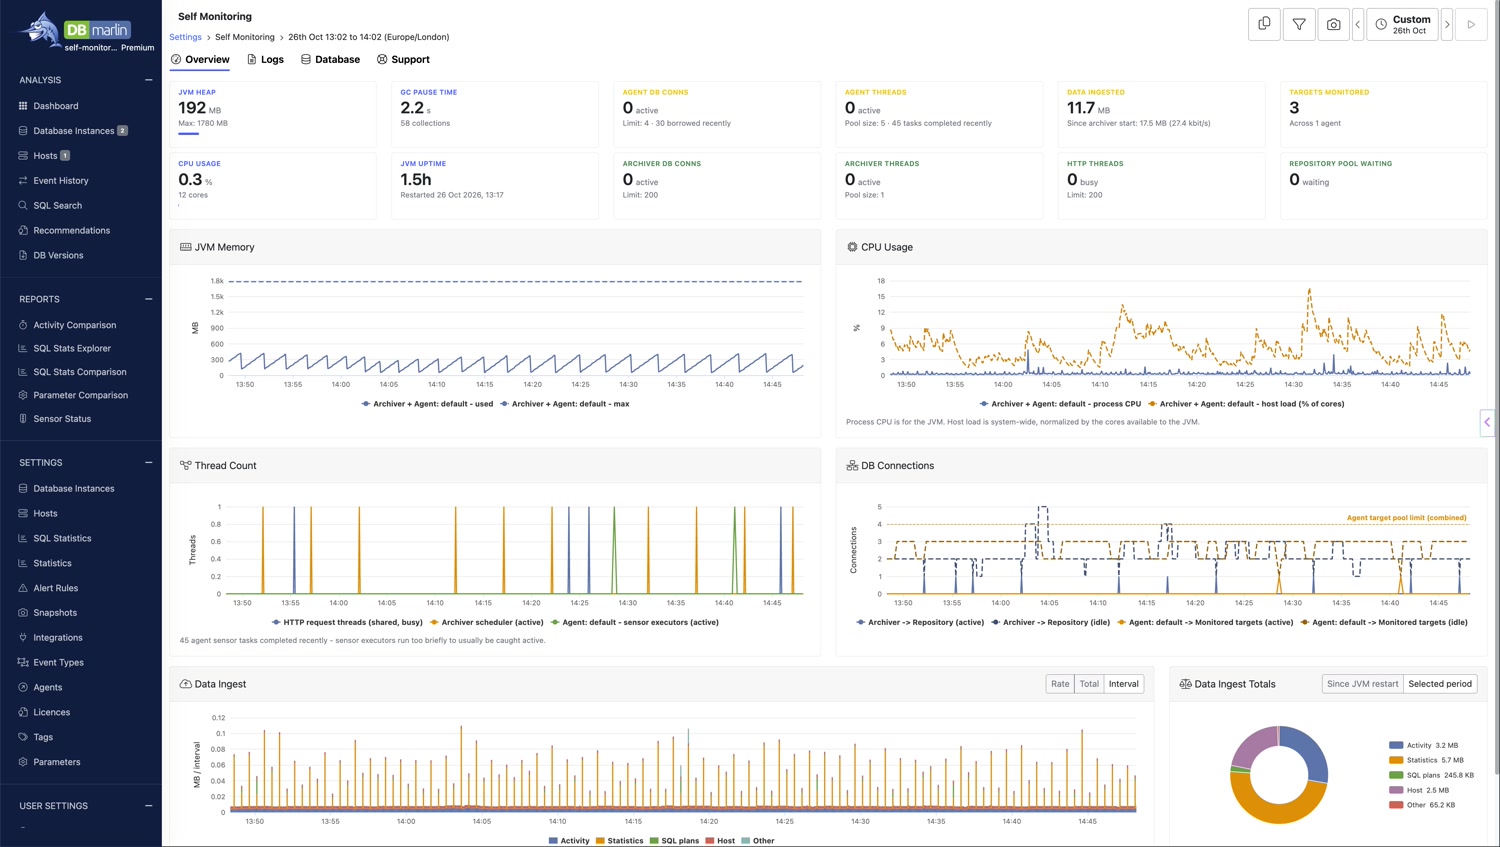
The Overview tab shows health metrics for the DBmarlin archiver and for each agent that sends them. The archiver collects a sample every 5 seconds and agents every 15 seconds. The archiver keeps the last 60 minutes of samples, so choosing a longer period in the time selector does not show more history.
Samples are held in memory, so the history starts again when DBmarlin Tomcat is restarted.
Summary tiles
The tiles at the top show the latest values. They are grouped by colour into the archiver JVM, the agents, and the archiver and API.
| Group | Tile | Description |
|---|---|---|
| Archiver JVM | JVM Heap | Java heap memory used by the archiver, and the maximum. |
| GC Pause Time | Time spent in Java garbage collection, and the number of collections. | |
| CPU Usage | CPU used by the archiver process, and the number of CPU cores. | |
| JVM Uptime | How long the archiver has been running since Tomcat last started. | |
| Agent | Agent DB Conns | Connections to monitored databases that are in use, and the limit. |
| Agent Threads | Sensor threads that are running, the thread pool size, and the number of tasks completed recently. | |
| Data Ingested | The amount of data received from agents, and the total since the archiver started. | |
| Targets Monitored | The number of database and host targets monitored, across all agents. | |
| Archiver and API | Archiver DB Conns | Connections to the DBmarlin repository database that are in use, and the limit. |
| Archiver Threads | Archiver background threads that are running, and the thread pool size. | |
| HTTP Threads | Tomcat threads busy handling requests from the UI, the API and agents, and the limit. | |
| Repository Pool Waiting | Requests waiting for a connection to the repository database. If this is often above 0, the repository connection pool may be too small. |
Sensor queries and database connections are usually only active for a few milliseconds at a time, so Agent DB Conns and Agent Threads often show 0 active even when monitoring is working normally. The borrowed recently and tasks completed recently figures show that they are being used.
Charts
Each chart shows one line per JVM: one for the archiver, and one for each agent. When an agent runs in the same Tomcat as the archiver, which is the default, they share one line.
| Chart | Description |
|---|---|
| JVM Memory | Heap memory used, with the maximum heap shown as a dashed line. |
| CPU Usage | CPU used by each JVM, and the host load as a percentage of CPU cores. |
| Thread Count | Busy HTTP request threads, active archiver scheduler threads and active agent sensor threads. |
| DB Connections | Active and idle connections from the archiver to the repository, and from agents to monitored targets, with the pool limits. |
| Data Ingest | Data received from agents, split by type: activity, statistics, SQL plans, object stats, host and other. Choose Rate for KB/s or MB/s, Total for the running total over the period, or Interval for the amount received in each sample. |
The Data Ingest Totals chart shows the share of data received by type. Choose Since JVM restart for all data since the archiver started, or the selected period.
Logs
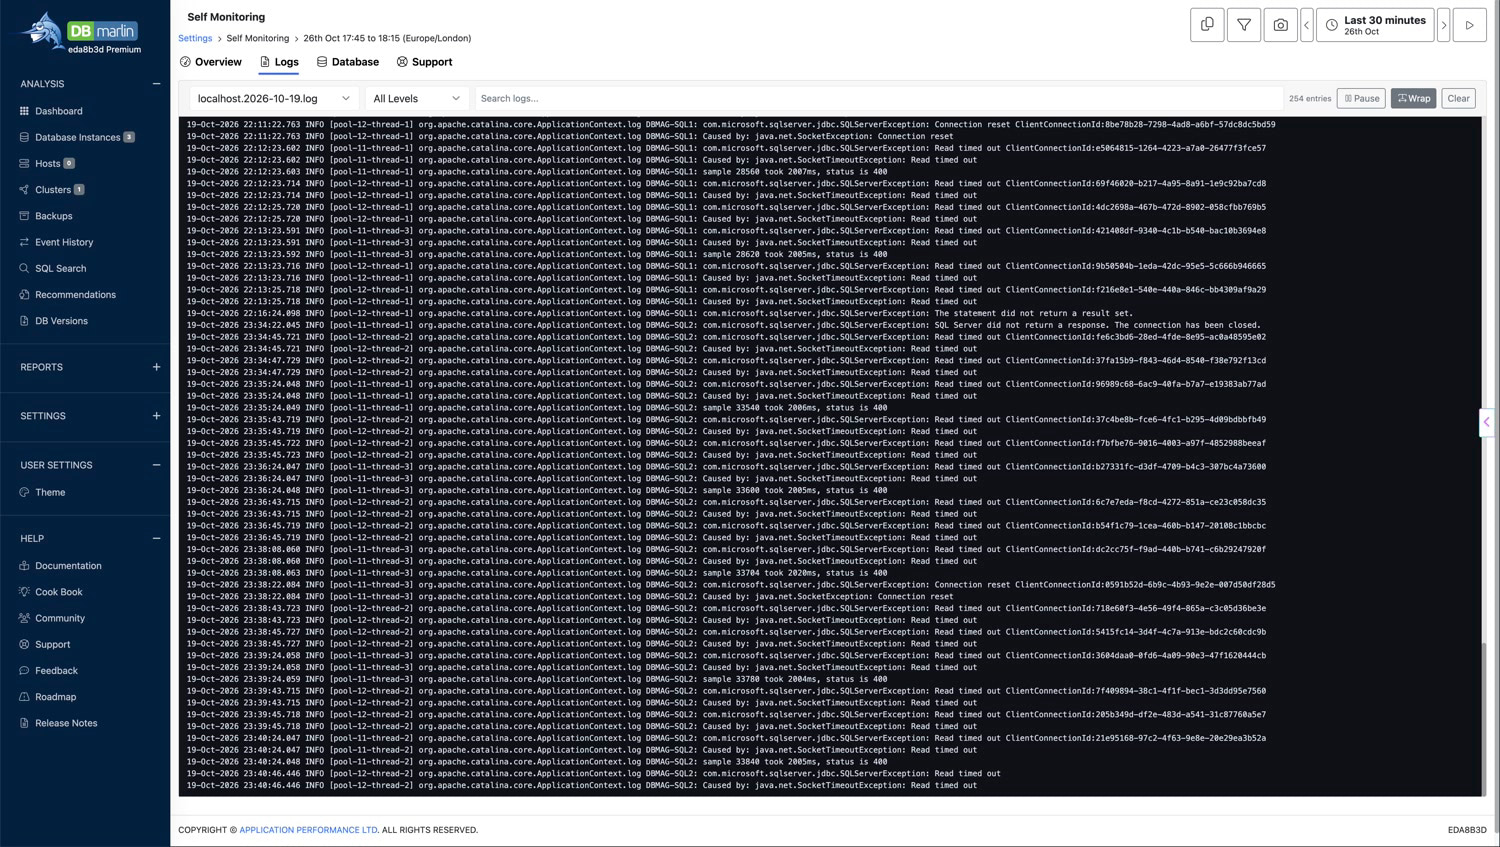
The Logs tab shows DBmarlin's log files in the browser and adds new lines as they are written, so you can watch the log while you reproduce a problem.
- Choose a log file from the drop-down. Files are grouped by source, with the newest first:
- Tomcat:
catalina.outand the datedcatalinaandlocalhostlogs. DBmarlin's own application log is thelocalhost.<date>.logfile, which is shown by default. - PostgreSQL: the repository database logs and the PostgreSQL startup log.
- nginx:
nginx-error.log.
- Tomcat:
- Use the level drop-down to show only Severe, Warning, Info, Config or Fine messages. Severe also includes PostgreSQL and nginx errors.
- Type in Search logs... to show only the lines that contain your text.
The number of matching lines is shown next to the search box. Use the buttons to:
- Pause and Resume following new lines.
- Wrap long lines to fit the screen, or scroll them horizontally.
- Clear the lines shown so far.
If the log file is rotated while you are viewing it, a message is shown and new lines are shown from the start of the new file.
Database
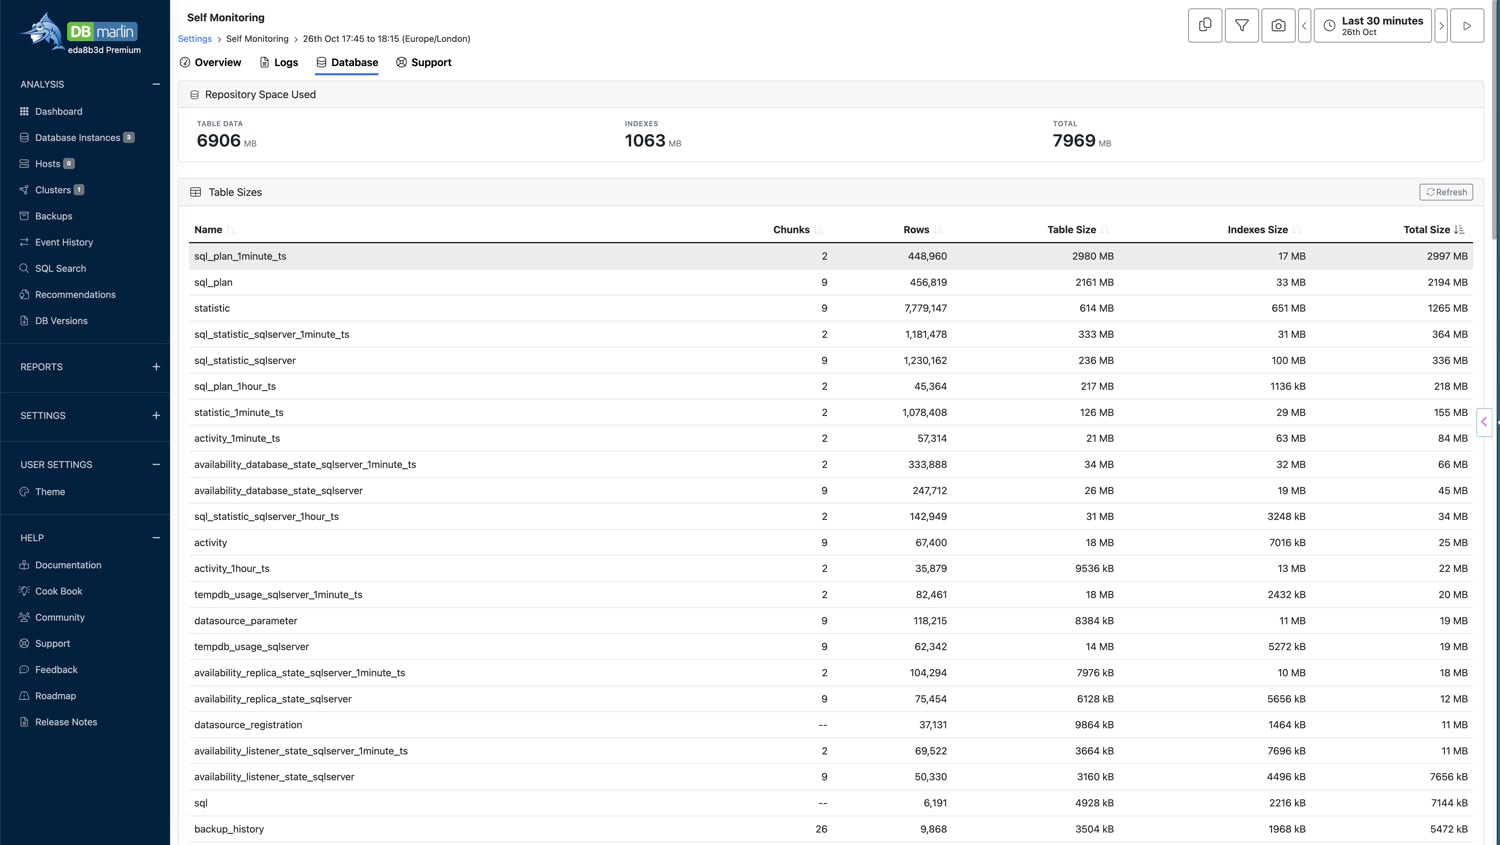
The Database tab shows how much space the DBmarlin repository database uses.
Repository Space Used shows the size of the table data, the indexes and the total.
Table Sizes lists the largest TimescaleDB hypertables in the repository, largest first. For each table, it shows the number of chunks, the number of rows, and the size of the table, its indexes and the total. Click a column heading to sort by it.
Working out the table sizes takes time on a large repository, so they are cached for a few minutes. Click Refresh to get the latest sizes.
If TimescaleDB is not installed in the repository database, the table sizes are not available.
Support
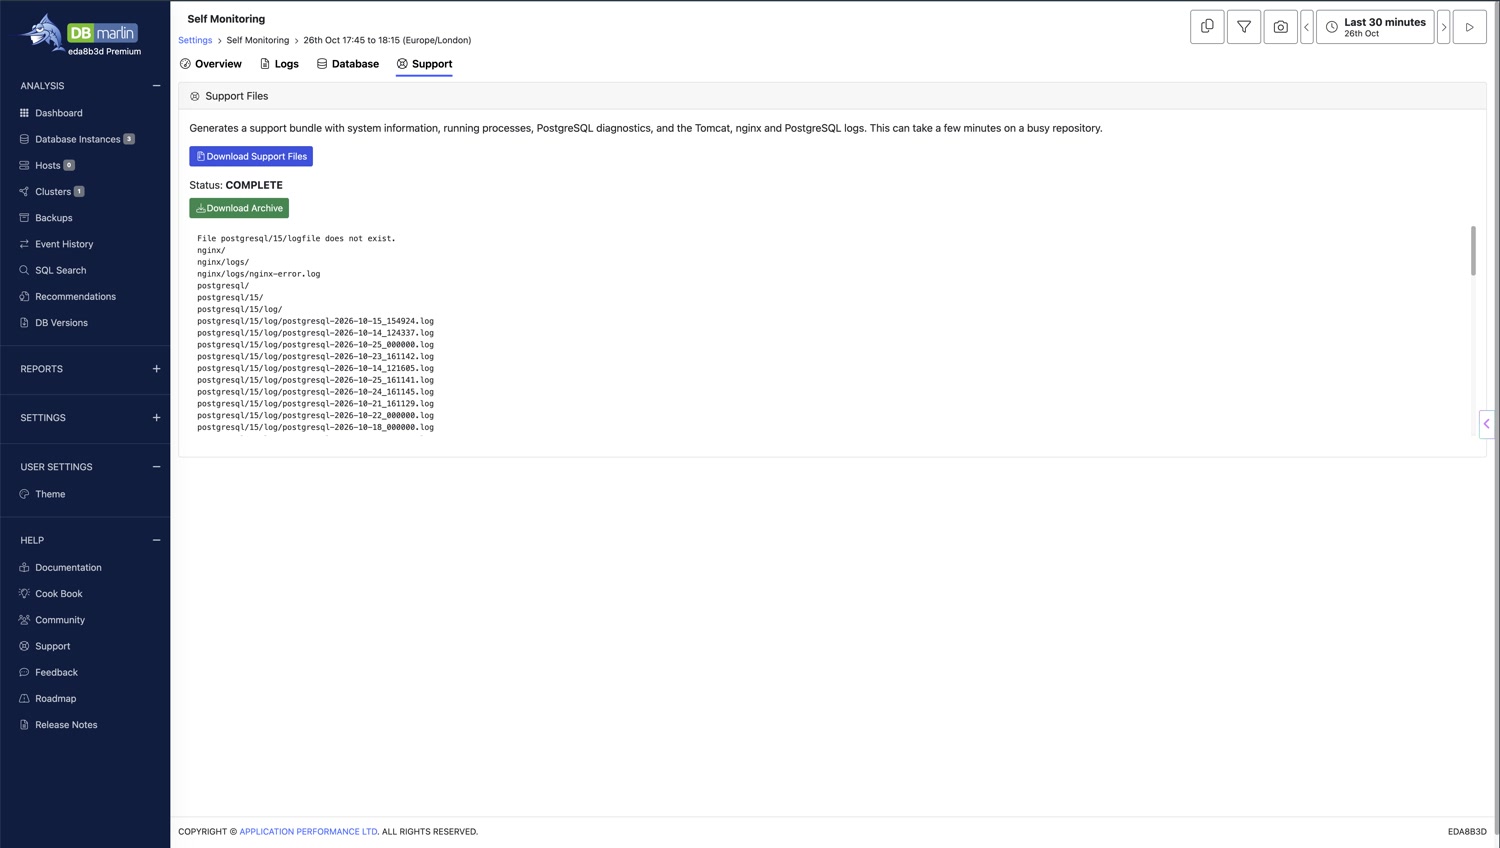
The Support tab generates a support bundle to send to DBmarlin support when you raise a support ticket. The bundle contains system information, running processes, PostgreSQL diagnostics, and the Tomcat, nginx and PostgreSQL logs.
- Click Download Support Files. The status and the output of the support files script are shown while the bundle is generated. This can take a few minutes on a busy repository.
- When the status is complete, click Download Archive to save the bundle.
Only one bundle can be generated at a time. If another admin has already started one, the screen shows its progress.
This does the same as running support_files.sh or support_files.bat on the DBmarlin server. See Getting log files for support.