SQL Always-on Availability Groups
New in DBmarlin 6.9.0. Currently SQL Server only.
DBmarlin monitors SQL Server Always On availability groups (AGs). For each group, you can see:
- whether every replica is connected and synchronized
- how much log is waiting to be sent and redone
- how much data you would lose, and how long recovery would take, if a secondary took over now
- whether the group is ready for automatic failover
Built-in alert rules can notify you when any of these go wrong, and when a failover happens.
Availability groups are found automatically when you monitor their SQL Server instances. They are listed under each cluster on the Clusters screen.
Opening the availability group screen
You can reach an availability group's screen in three ways:
- From Analysis → Clusters: open a cluster, then click the group name in the Availability groups table.
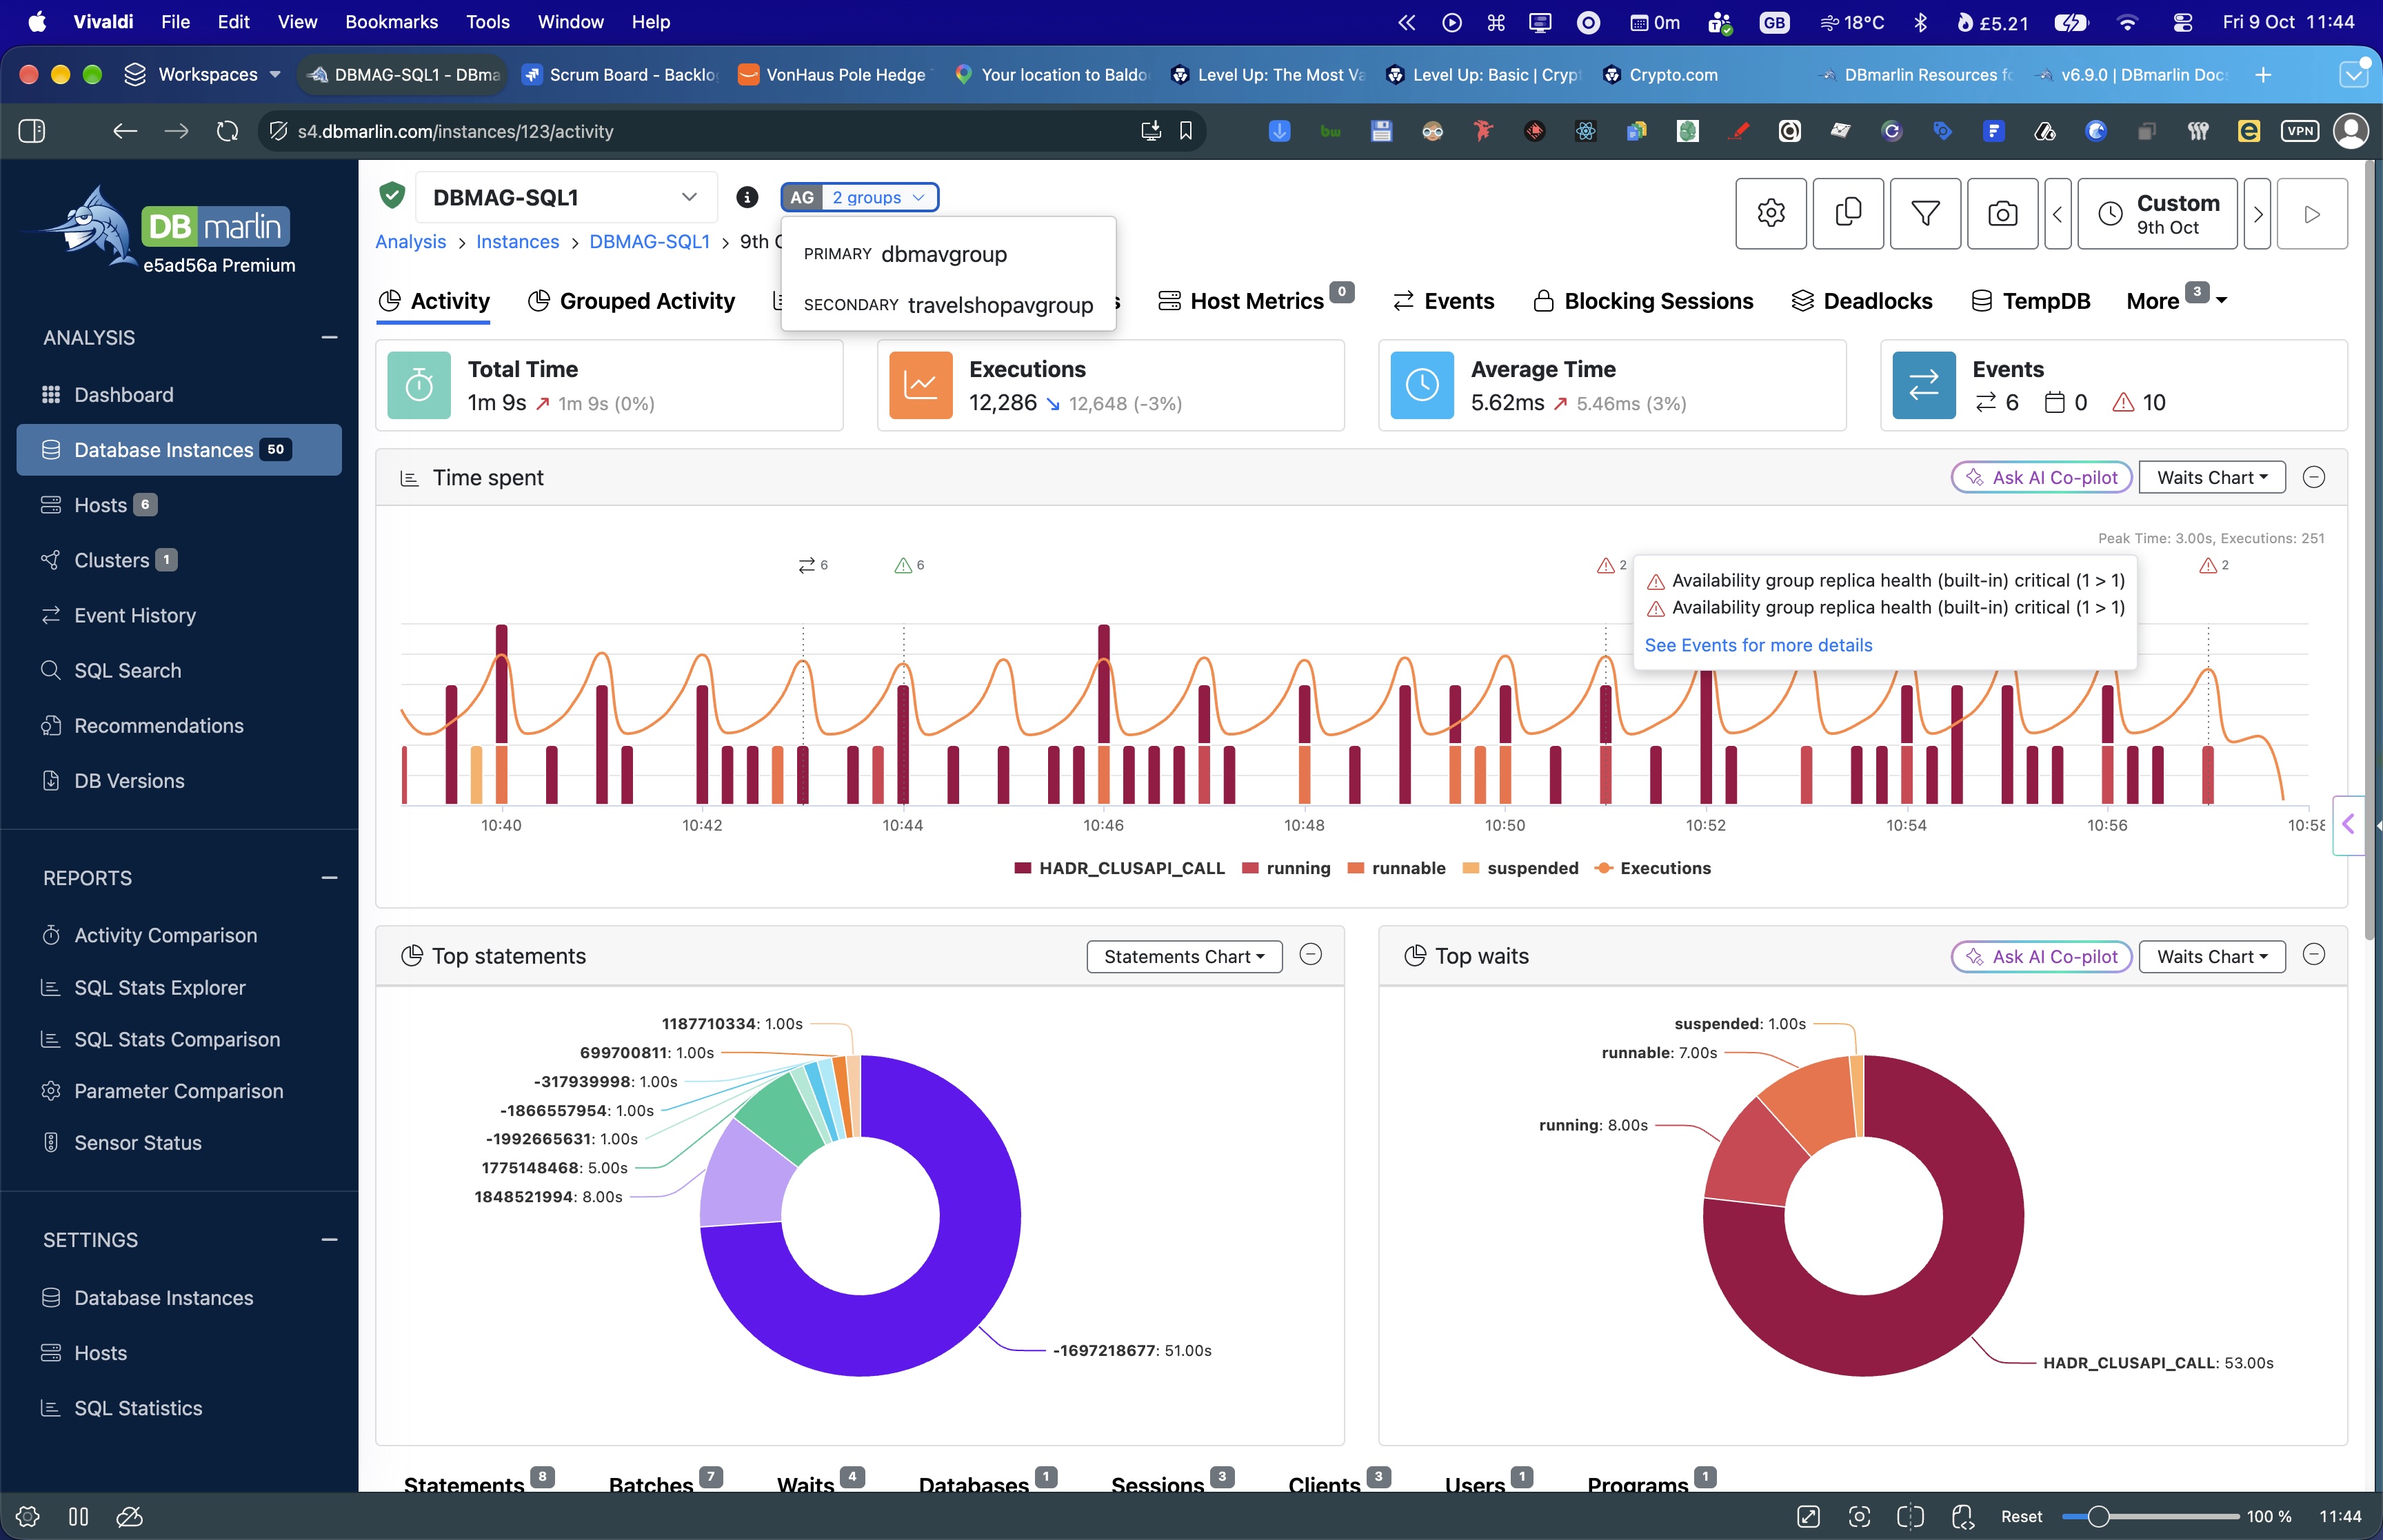
- From any SQL Server instance screen: click the availability group badge in the header.
- From an alert notification: availability group alerts link straight to the group.
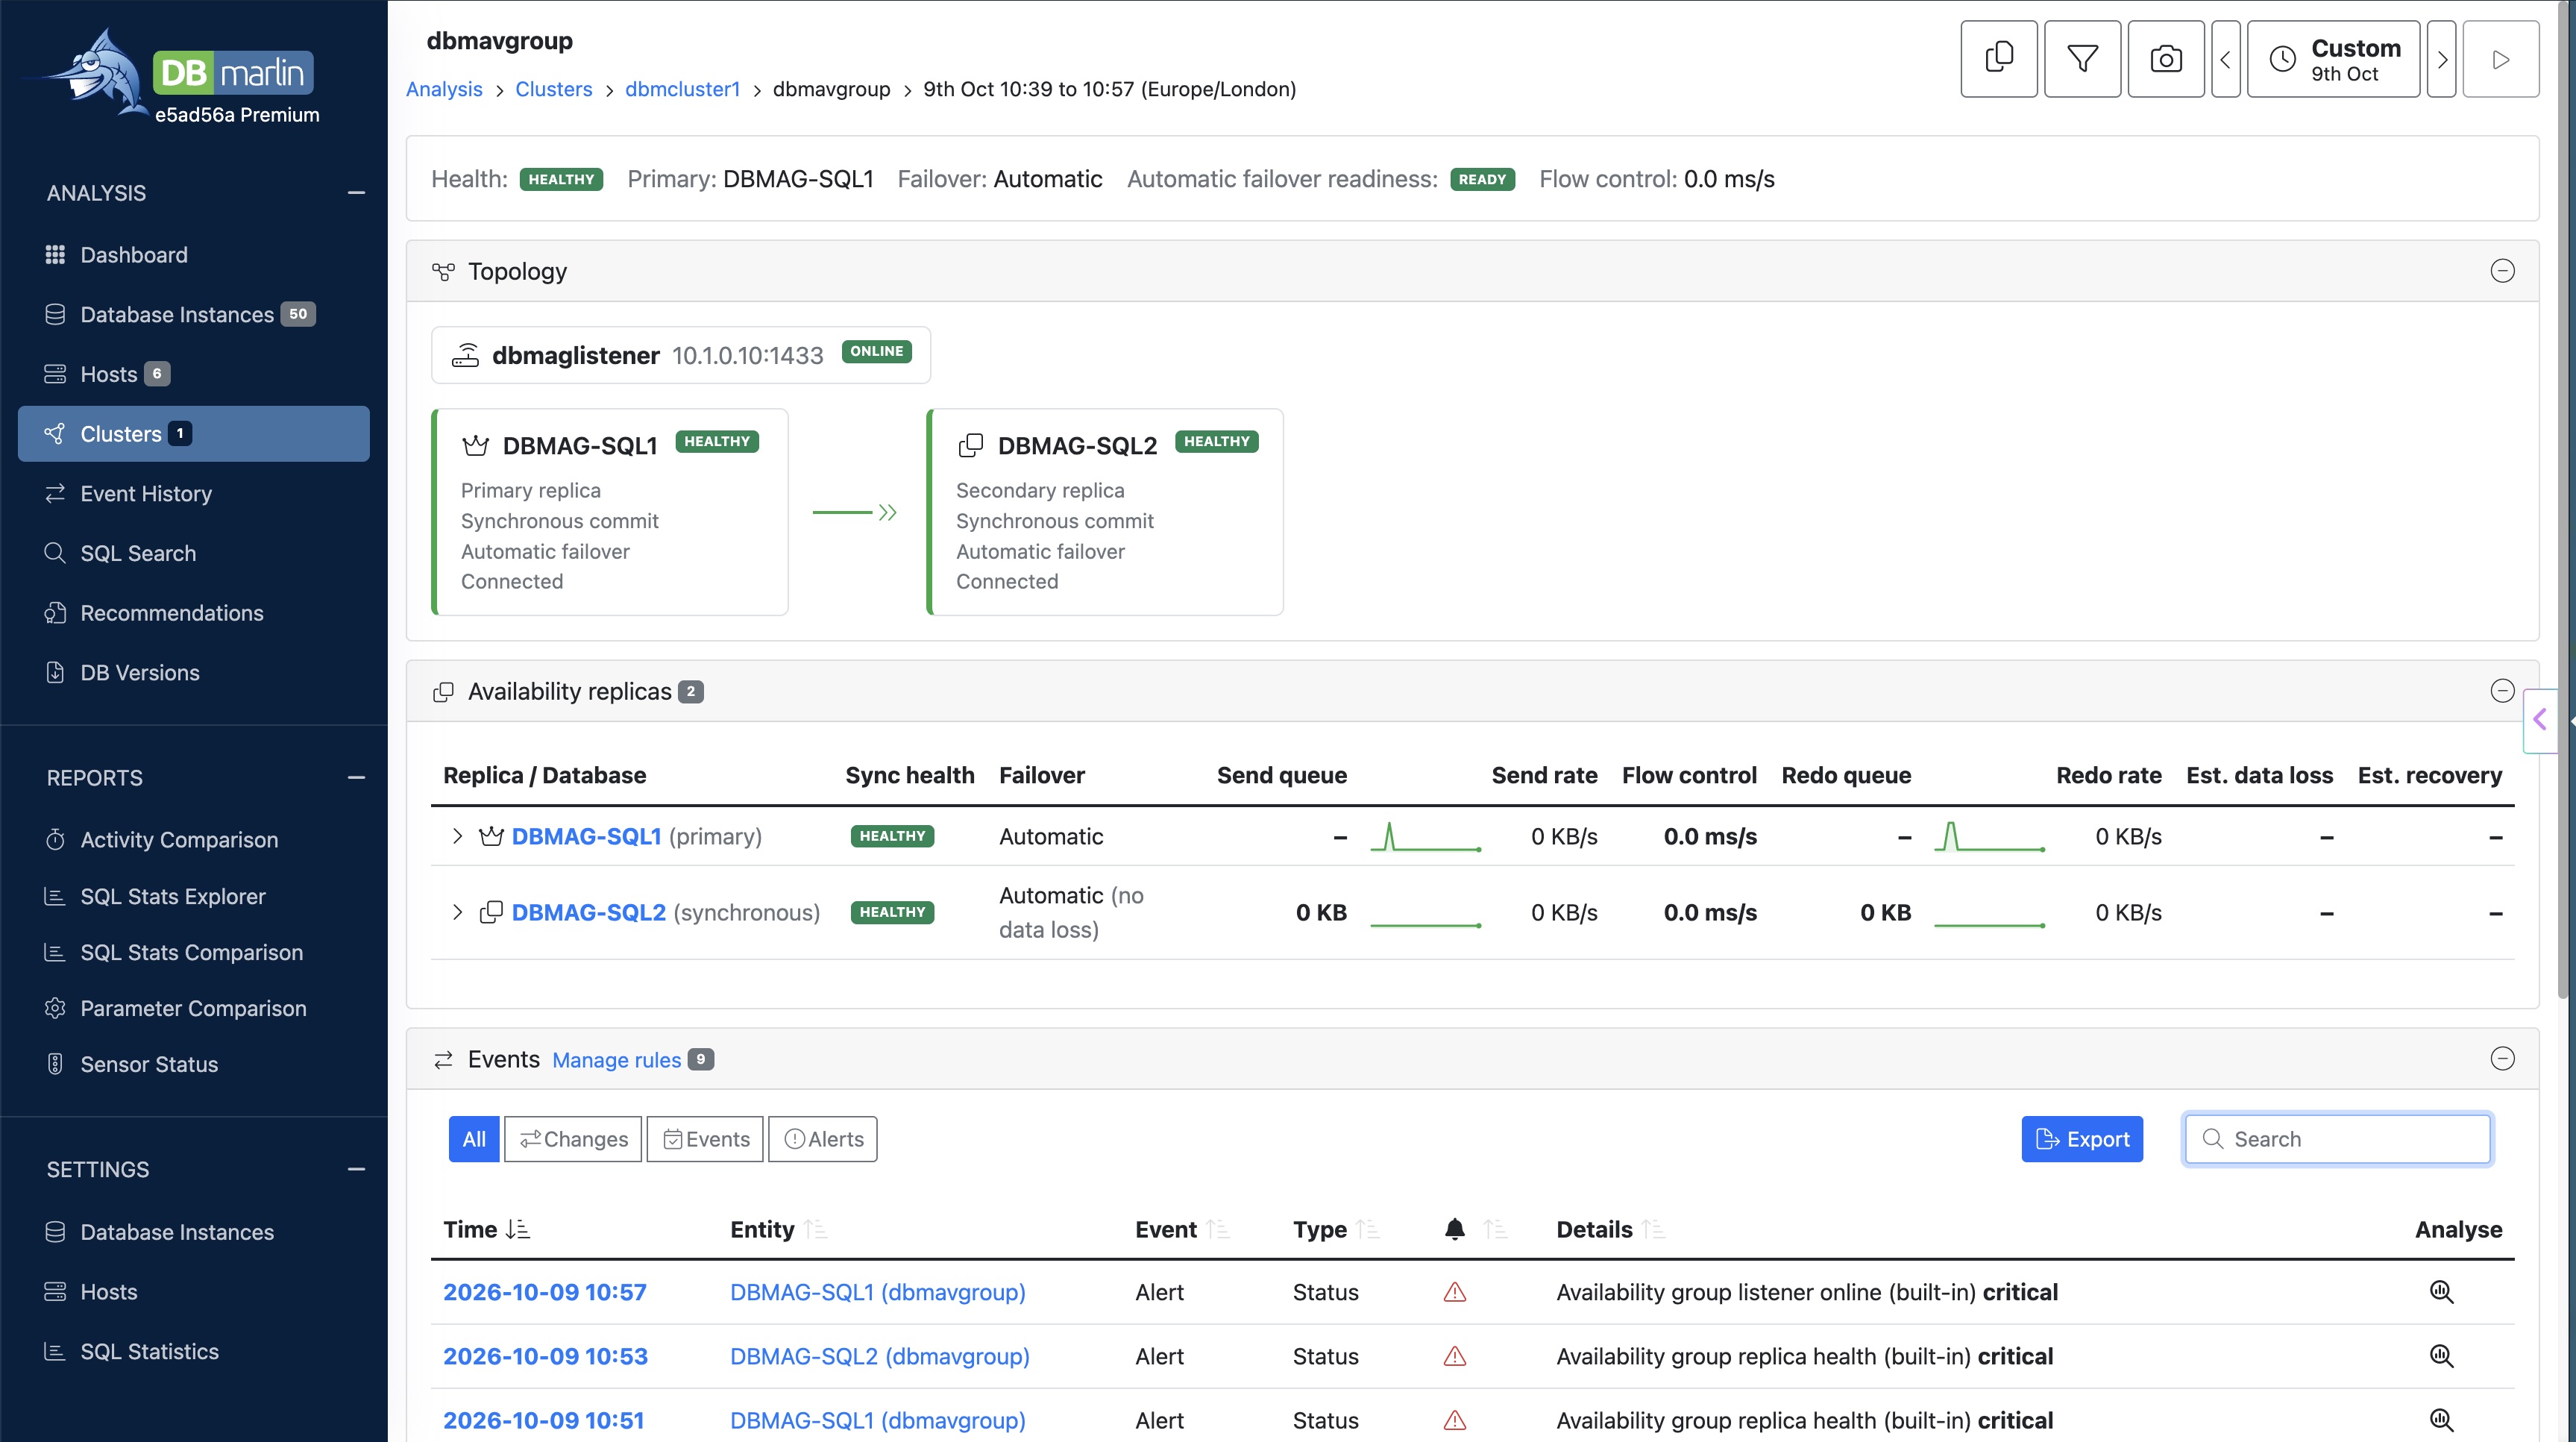
Summary strip
| Item | Description |
|---|---|
| Health | HEALTHY when every replica is connected and every database is healthy. Otherwise NOT HEALTHY. |
| Primary | The server that currently holds the primary replica |
| Failover | Automatic or Manual, from the primary replica's failover mode |
| Automatic failover readiness | READY when every database on the secondary replicas can fail over without losing data. Otherwise NOT READY. |
| Flow control | The worst time, in ms per second, that the primary spent throttled while it sent log to a secondary. A dash means that no monitored instance is sending to a secondary in this group. |
If DBmarlin hasn't received data from any replica in the group for the last few minutes, a message shows when the last data arrived, and the states are shown as UNKNOWN. They are not shown as the last state seen, because that may no longer be true.
Topology
The topology diagram shows how the group is laid out:
- Listener: its DNS name, IP addresses, port and state (
ONLINEorOFFLINE). This is shown when the group has a listener. - Primary replica: marked with a crown icon.
- Secondary replicas: each shows its availability mode (synchronous or asynchronous commit), its failover mode and whether it is connected.
- Data flow arrows: one arrow from the primary to each secondary.
- A double chevron means log blocks are flowing.
- A cross means the secondary is disconnected and data movement has stopped.
- A question mark means there is no recent data.
Each replica card is coloured by its synchronization health. If the group is not ready for automatic failover, a warning strip appears below the diagram.
Availability replicas
This table has one row for each replica. Click a replica row to show or hide the databases under it. A replica row adds up its databases (queues and rates are totalled, and data loss and recovery time show the worst database), so the figures still make sense when the row is collapsed.
If you also monitor the replica as a DBmarlin instance, its server name is a link to that instance's Activity screen, using the same time range.
| Column | Description |
|---|---|
| Replica / Database | The replica server and its role (primary, synchronous or asynchronous), with its databases below it. A SUSPENDED badge means data movement is suspended for that database. |
| Sync health | The synchronization health of the replica, or the synchronization state of the database. A DISCONNECTED badge means the replica has lost its connection. |
| Failover | Automatic or Manual. For a secondary, (no data loss) means it can fail over without losing data. A warning icon means it can't. |
| Send queue | Log on the primary that hasn't been sent to this secondary yet |
| Send rate | The rate at which log is being sent to this secondary, with a sparkline for the selected period |
| Flow control | The time per second that the primary spent throttled while it sent to this replica |
| Redo queue | Log received by this secondary that hasn't been redone yet |
| Redo rate | The rate at which this secondary is redoing log, with a sparkline for the selected period |
| Est. data loss | The estimated data loss if this replica took over now. This is your current RPO. |
| Est. recovery | The estimated time to recover if this replica took over now. This is your current RTO. |
Reading the values
- – (a dash) means the figure doesn't apply to this row. For example, SQL Server doesn't record send queues or flow control on the primary's own row, because the primary doesn't send to itself.
- N/A means DBmarlin couldn't measure the rate. Monitor that replica as a DBmarlin instance so the rate can be measured.
- An asterisk (*) after a rate means the figure is the last one SQL Server reported, not one DBmarlin measured on the replica. Hover over any rate to see where it came from.
Rates are never shown as zero when they are unknown, so zero always means that nothing is happening.
Events
The Events table lists failovers, health changes, and alerts raised and recovered for this availability group in the selected time period. Its columns are the same as on the Event History screen. Use the Manage rules link to go to the alert rules.
Alerts
DBmarlin 6.9.0 adds a new alert entity type, Availability Group, with five built-in rules. Like the other built-in rules, they are disabled by default. To turn them on, go to Admin → Alert Rules and enable the rules you want.
| Built-in rule | Raises an alert when | Default severity |
|---|---|---|
| Availability group replica health | A replica is disconnected, or its role is RESOLVING (neither primary nor secondary) | Critical |
| Availability group database health | A database on a connected replica isn't healthy, or its data movement is suspended | Critical |
| Availability group listener online | A listener for the group isn't online | Critical |
| Availability group ready for automatic failover | A database on a secondary replica isn't ready to fail over without data loss | Warning |
| Cluster failover | The availability group failed over to a different primary during the evaluation window | Info |
Each rule raises an alert when its count reaches the threshold (1 by default). It recovers when the count drops below the threshold again.
Scoping availability group rules
When you create or edit a rule with the Availability Group entity type, you can limit which groups it covers:
- Availability groups: pick one or more groups by name, or leave the field empty to cover all availability groups.
- Instances and Tags: limit the rule to groups whose replicas are on particular instances, or on instances with particular tags.
You can also create your own availability group rules with a different severity, scope or notification channel. Availability group alerts use the same notification channels as other DBmarlin alerts, such as email, Slack, PagerDuty, ServiceNow and webhooks. Each notification includes a link to the availability group screen.
When no data is received
If DBmarlin stops receiving data for an availability group, for example because no replica can be reached, an alert that is already open stays open. It only recovers once fresh data shows that the problem has cleared. A gap in monitoring therefore never looks like a recovery.
Requirements
- SQL Server 2012 or later, with Always On availability groups running on a Windows Server Failover Cluster.
- At least one replica of each availability group must be monitored as a DBmarlin SQL Server instance. We recommend monitoring every replica (see Clusters).
- The availability group views are read with the same login that DBmarlin already uses to monitor the instance.