Hosts Overview
The Hosts overview screen gives a high-level performance overview across all hosts.
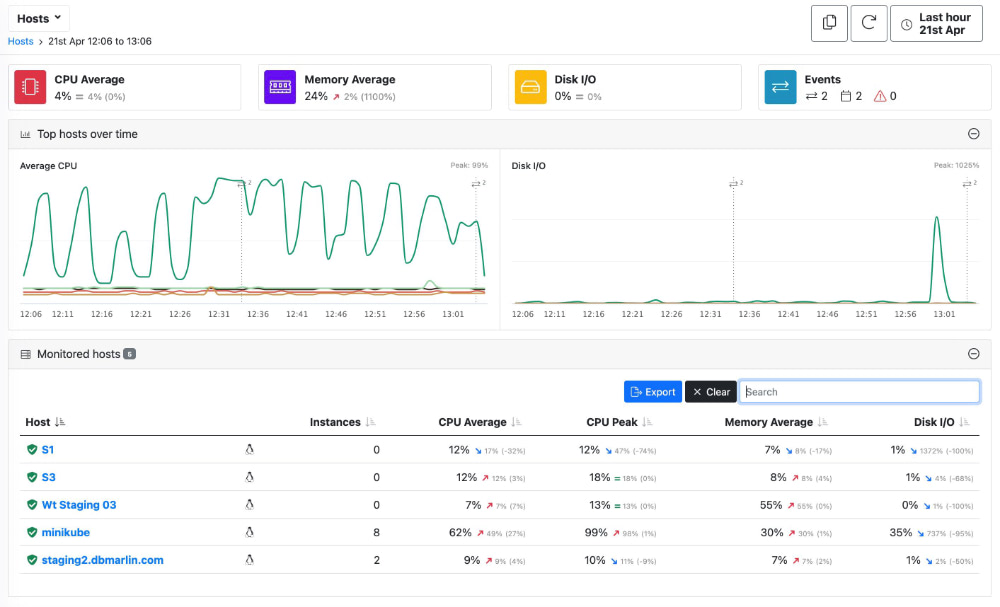
If you mouseover the health icon you can see the status of the host as a tooltip. You can use the Search box to filter the table by any of the visible columns as well as hidden columns such as database version.
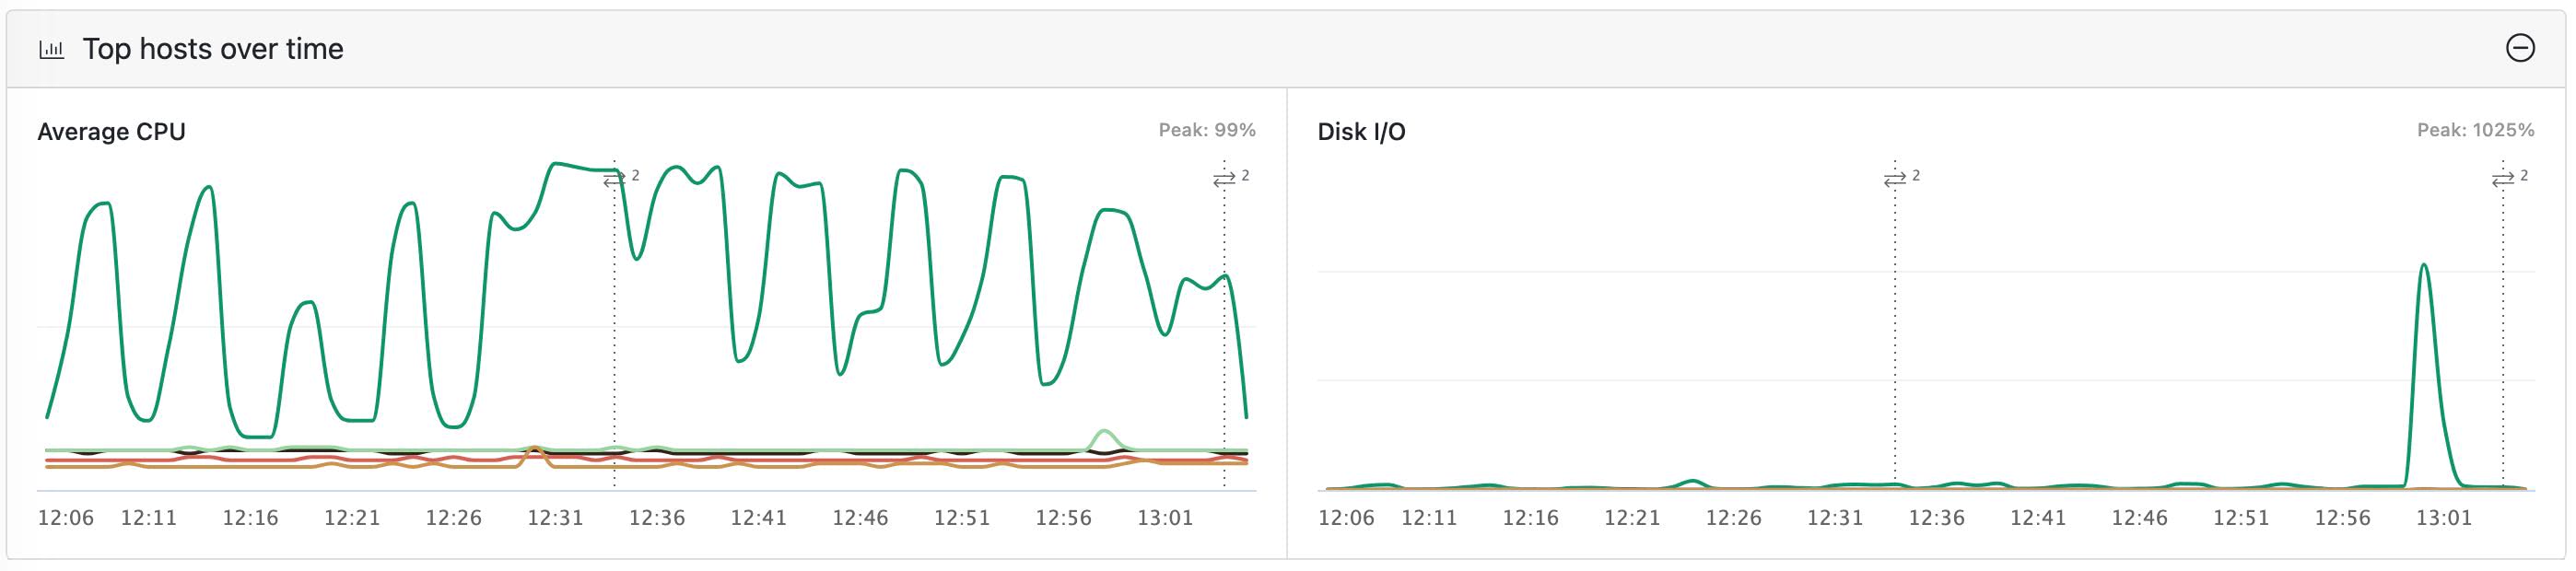
Top Hosts over time
The 2 charts show CPU and Memory usage over time for the period selected for all hosts so you can see how they compare. This widget may be hidden or viewed using the + or - symbols on the top right of the element. Mouseover any of the data series in either chart shows a tooltip with information about the nearest data point.
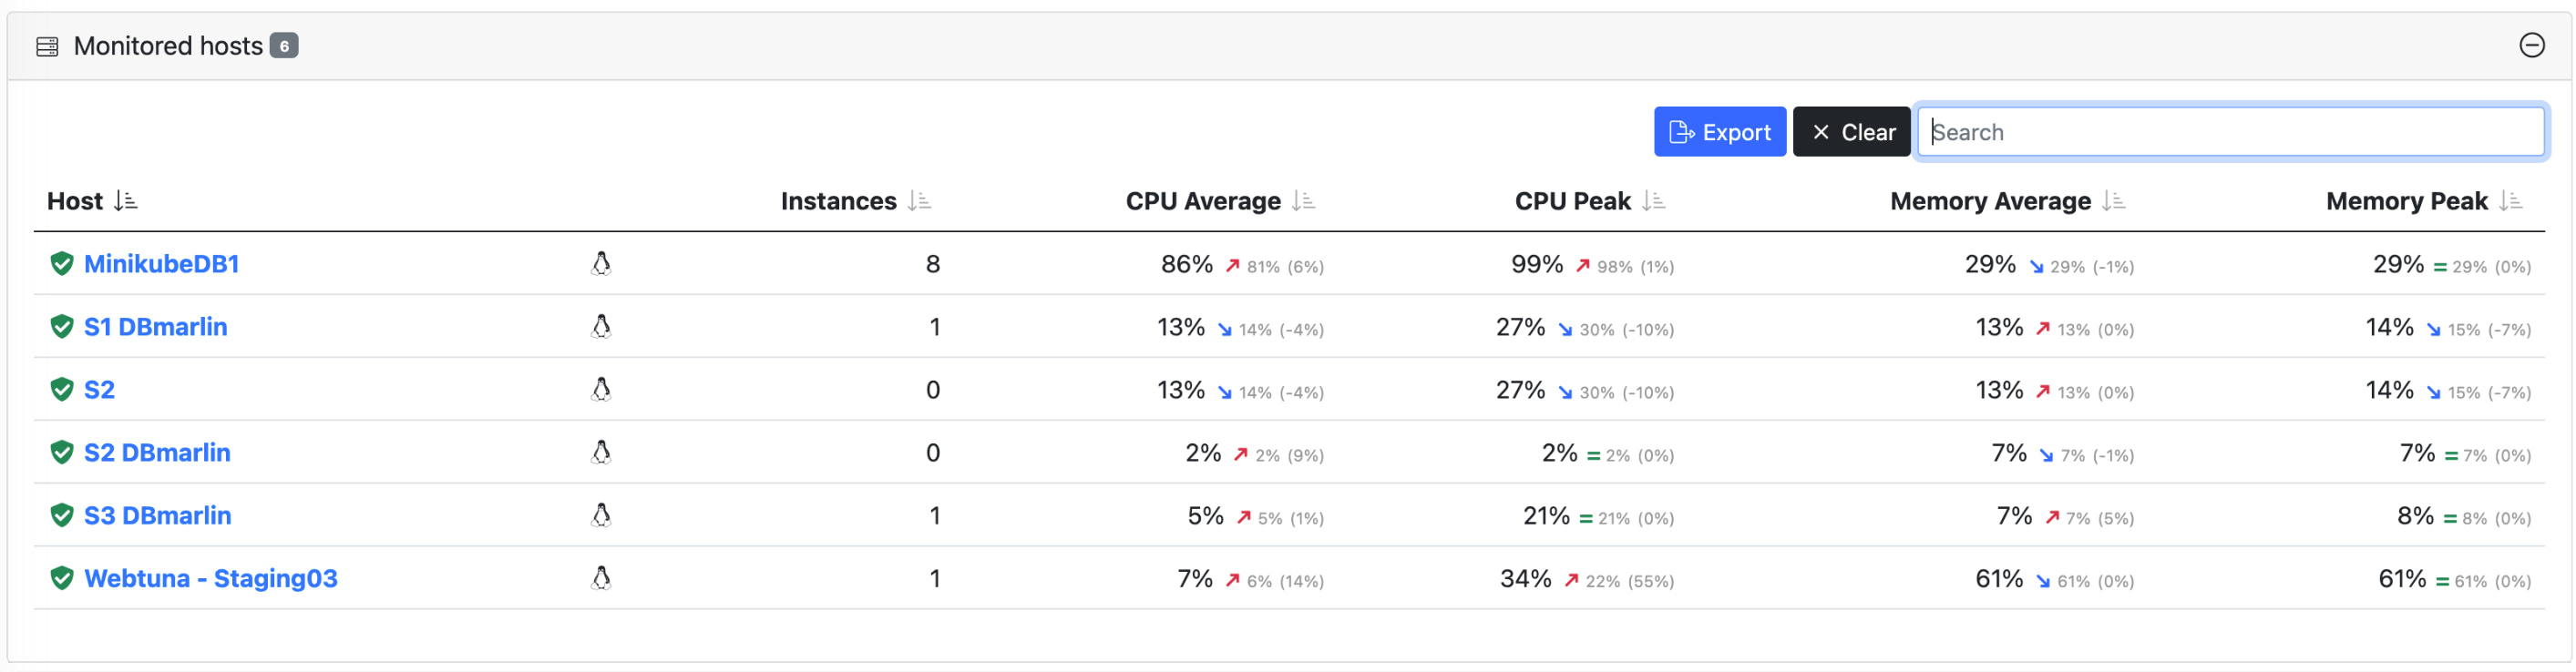
Monitored Hosts table
The table can be filtered using the search box and exported to CSV using the export button. The shield symbol/colour indicates the status of the monitored database. This widget / element may be hidden or viewed using the + or - symbols on the top right of the element.