Instance Dashboard
The database instance dashboard screen gives a complete performance overview of the database instance, the activity within it and the host it is running on. These are the main tabs at the top of the screen:
- Database Activity - DB activity by Statements and many more dimensions.
- Activity (Grouped Statements) - DB activity by Grouped Statements and many more dimensions.
- SQL Statistics - More Statement metrics such as Logical reads, writes and more.
- Database Statistics - Database statistics such as connections, session and more.
- Host Metrics - Host metrics such as CPU, I/O and memory for the DB host.
- Events - Events for the selected instance such as changes, custom events or alerts.
- Blocking Sessions - Blocking sessions showing locking trees of who was holding locks and who was locked.
- Transaction Contention - For CockroachDB shows the transactions holding locks and the ones that were blocked and for how long.
- Deadlocks - List of Deadlocks for the selected time period.
- TempDB - For SQL Server shows the activity against TempDB.
- Parameters - Shows a list of all database parameters/settings.
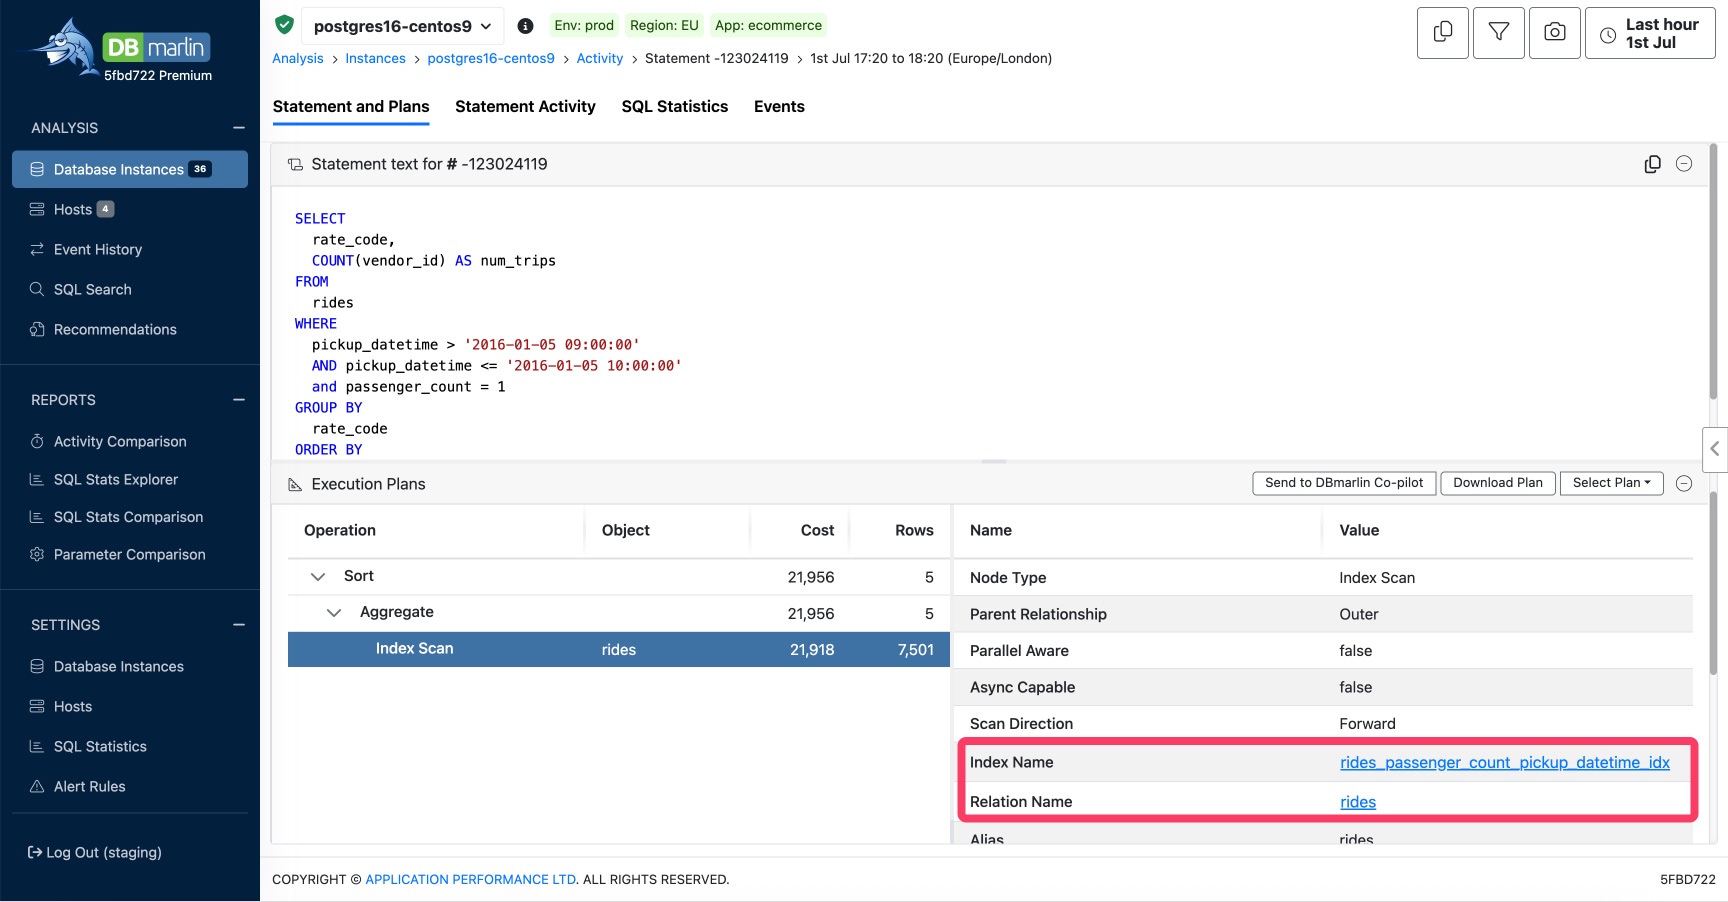
- Object Browser - Lets you browser the table and index in the database to see their definitions, statistics and insights.
- Agent Jobs - Lets you SQL Agent Job history for SQL Server.
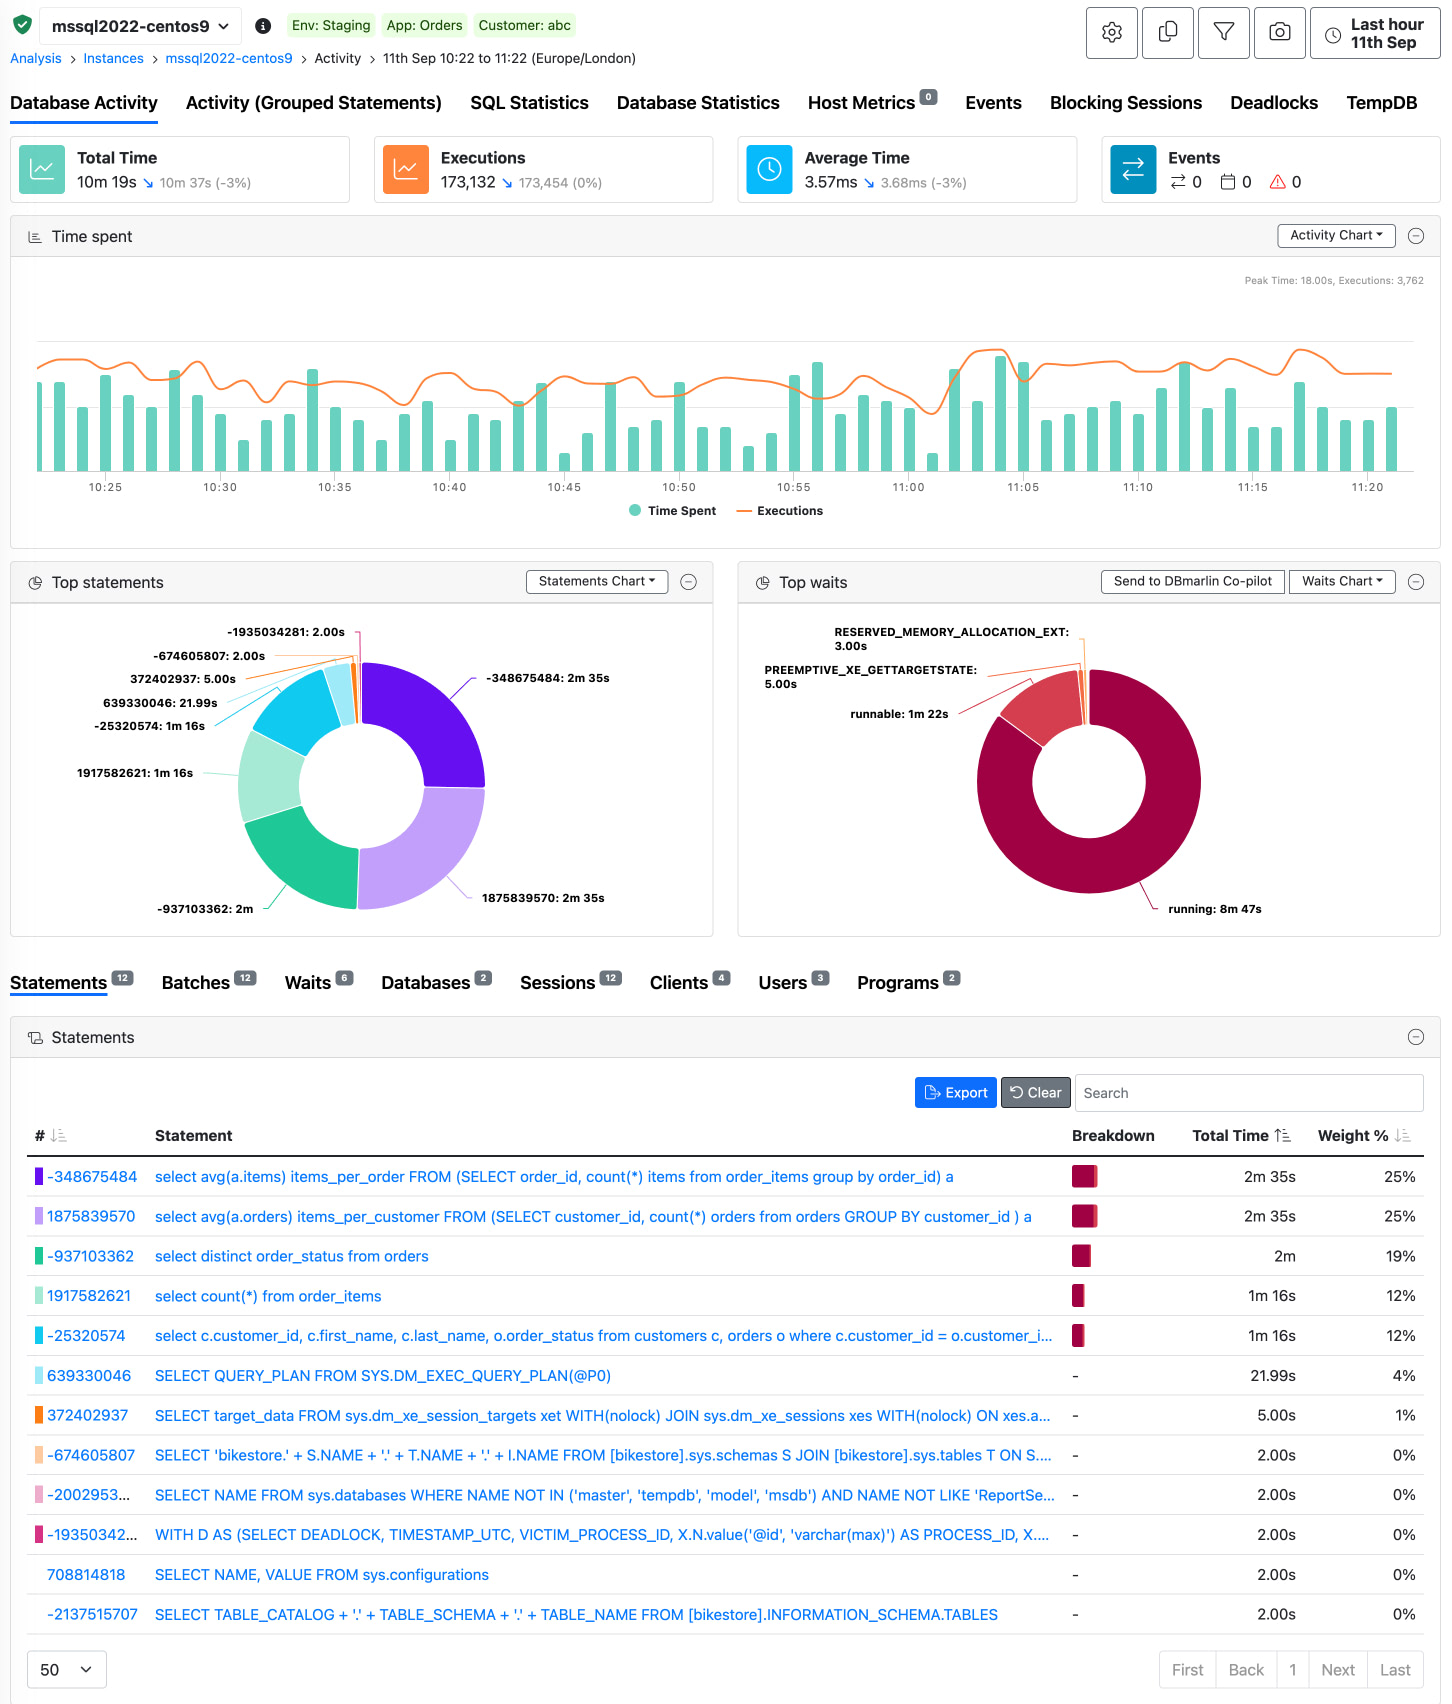
Database Activity Tab
KPI Widgets
The key performance indicators at the top of the screen are there to show top level metrics and alerts.

- DB Time - This is the total amount of time spent executing SQL statements within the selected period.
- Executions - This is the total number of SQL executions within the selected period.
- Average Time - This is the average SQL response time within the selected period.
- Change History - This shows 2 values: 1) the total number of changes within your environment such as schema changes or database parameter changes within the time range selected and 2) any custom events you have created for things like code releases or infrastructure changes.
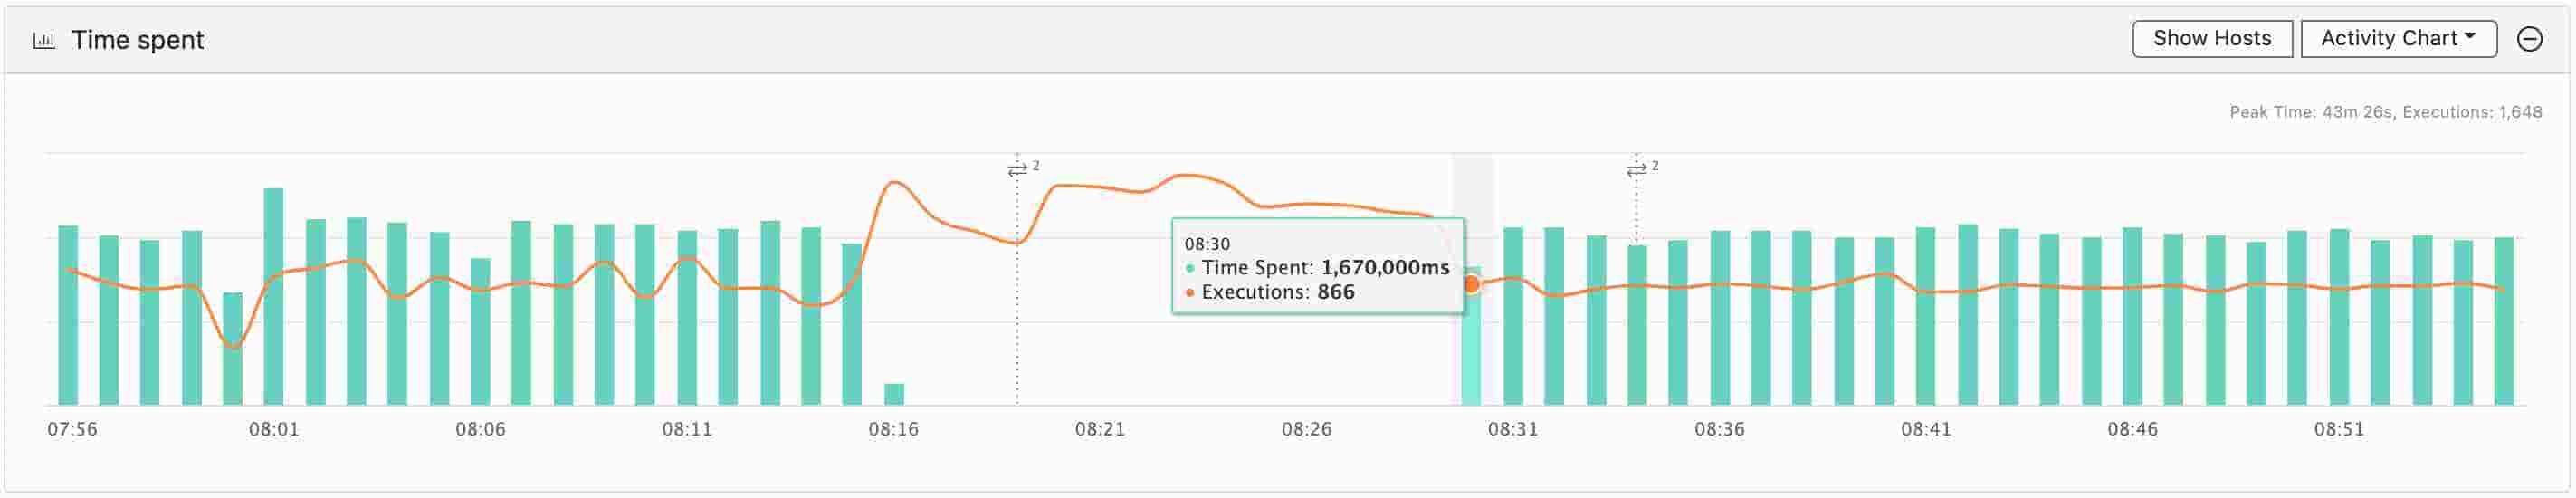
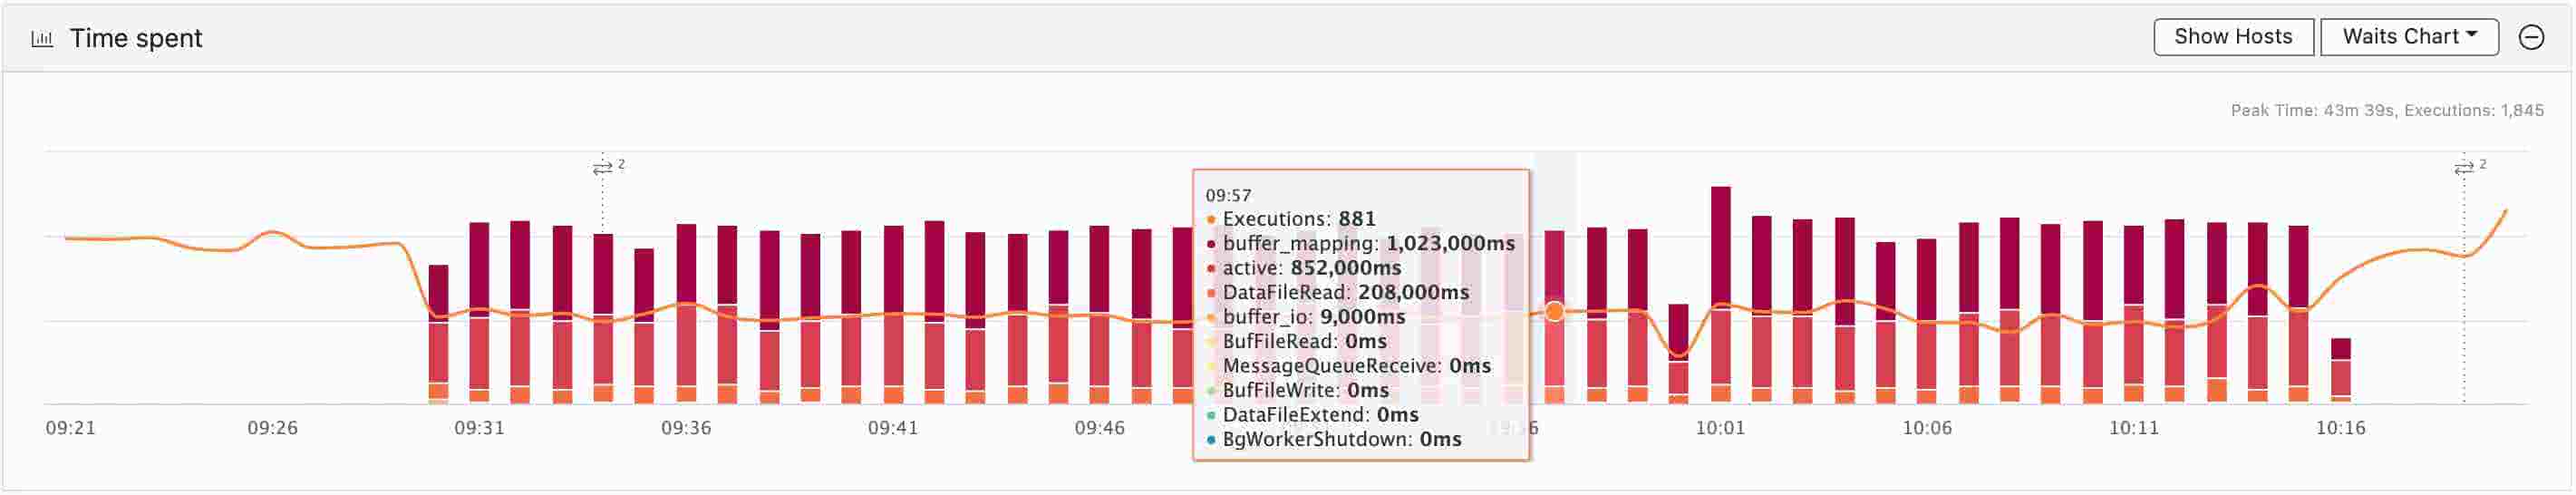
Performance over time
Time Spent and Executions over time for the period selected. If any changes have been detected, or manually added, they will be displayed as annotated markers on the timeline.
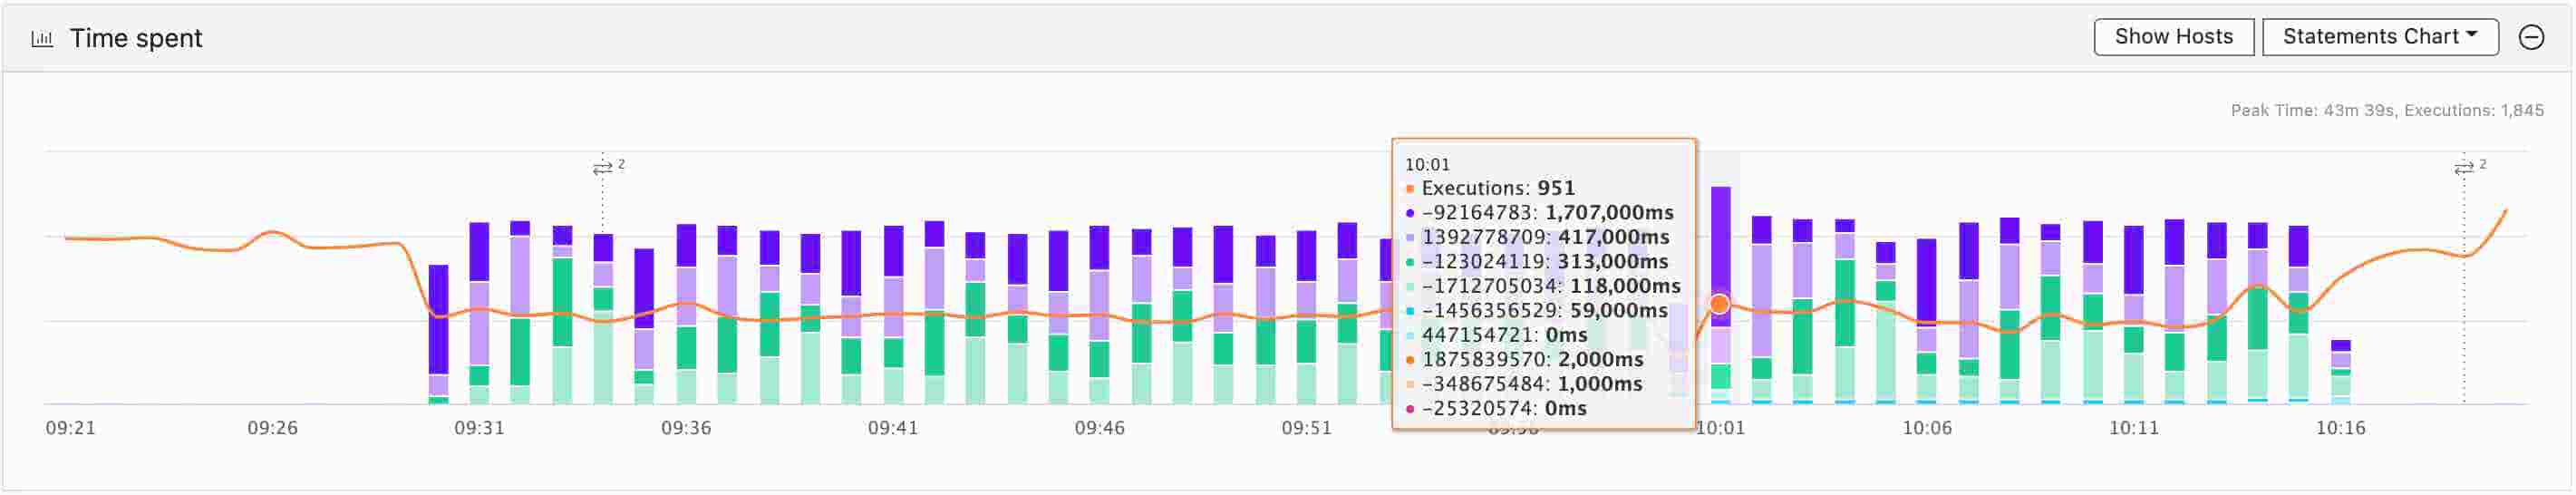
Statements over time
From the menu in the top right of the chart you can switch to the statements over time view. The statements in this bar chart are clickable to drill down to the statement details.
Wait states over time
From the menu in the top right of the chart you can switch to the wait states over time view.
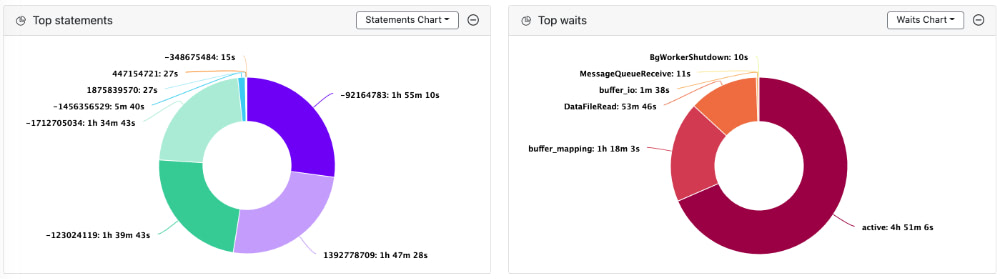
SQL & Wait state breakdown
The first ring chart shows the top 10 SQL statements by total DB time. The colours match those in the table below. The second ring chart shows a breakdown of the top 10 wait states.
Lower tabs
The lower tabs show the top SQL, Databases, Sessions, Programs, Client, Batches, Users as well as Changes. Note that some columns are not available depending on which database type you are looking at; for example, programs is not available for MySql and batches is only there for SQL Server. Each of these tables may be sorted by clicking in the column headings which have the arrow pairs. After sorting, the highlighted arrow shows the direction of sort.
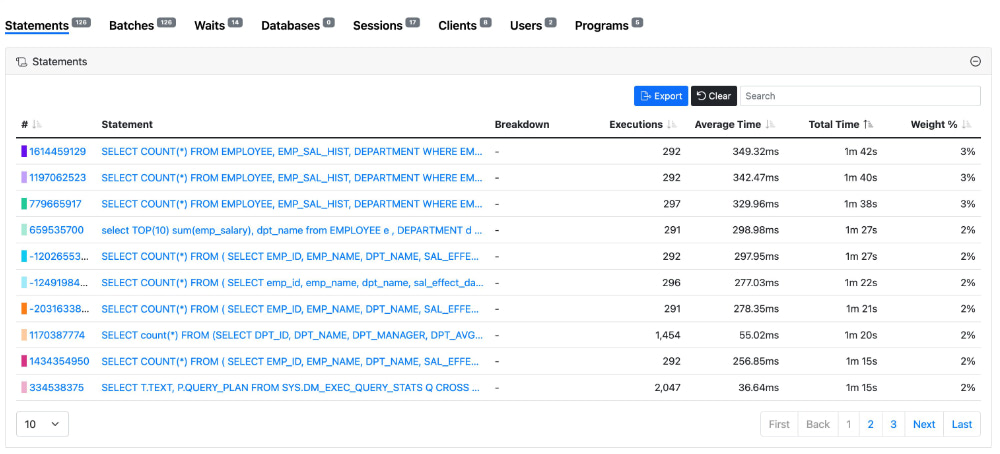
Top SQL
Top SQL statements sorted by total DB time. An inline bar chart is displayed for any statements whose weighted % is more than 5% and coloured to match the ring chart above. Clicking on the statement id or the statement itself will then take you on to the SQL view for that statement.
Hovering over the statement will display a scrollable tooltip where you can see up to 2000 characters of the SQL statement.
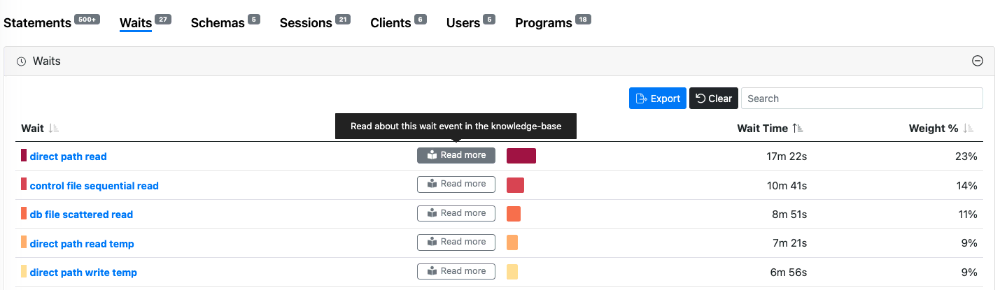
Top Waits
Top wait events sorted by the total DB time. For each wait event, there is a button, which lets you click through to the Knowledge-base to find out more information about the wait event and recommended actions in order to to reduce it.
Top Databases
Top Databases sorted by total DB time. If you have enabled the Instana integration then a button will be shown here if the matching database is found in Instana.
Top Sessions
Top Sessions sorted by total DB time.
Top Clients
Top Clients sorted by total DB time.
Top Users
Top Users sorted by total DB time.
Activity (Group Statements) Tab
This contains the same information as the Database Activity tab except that SQL Statements are normalised by stripping out any literals, so that similar statements which only differ by one or more literal values, are grouped together as a single entity.
For example these 3 statements below:
SELECT * FROM DESTINATIONS WHERE COUNTRY = 'London';
SELECT * FROM DESTINATIONS WHERE COUNTRY = 'Paris';
SELECT * FROM DESTINATIONS WHERE COUNTRY = 'New York';
would get grouped together as:
SELECT * FROM DESTINATIONS WHERE COUNTRY = ?
Having the grouped statements view means that you can see the impact of statements which might individually only be small resource consumers, but when grouped together, may have a substantial impact on database performance.
You can click to the Statements tab in the table in the lower half of the screen to see the individual statements within the group.
For SQL Server we also have Grouped Batches which follow the same rules as Grouped Statements.
Host Metrics Tab
KPI Widgets
The key performance indicators at the top of the screen are there to show top level metrics and alerts.

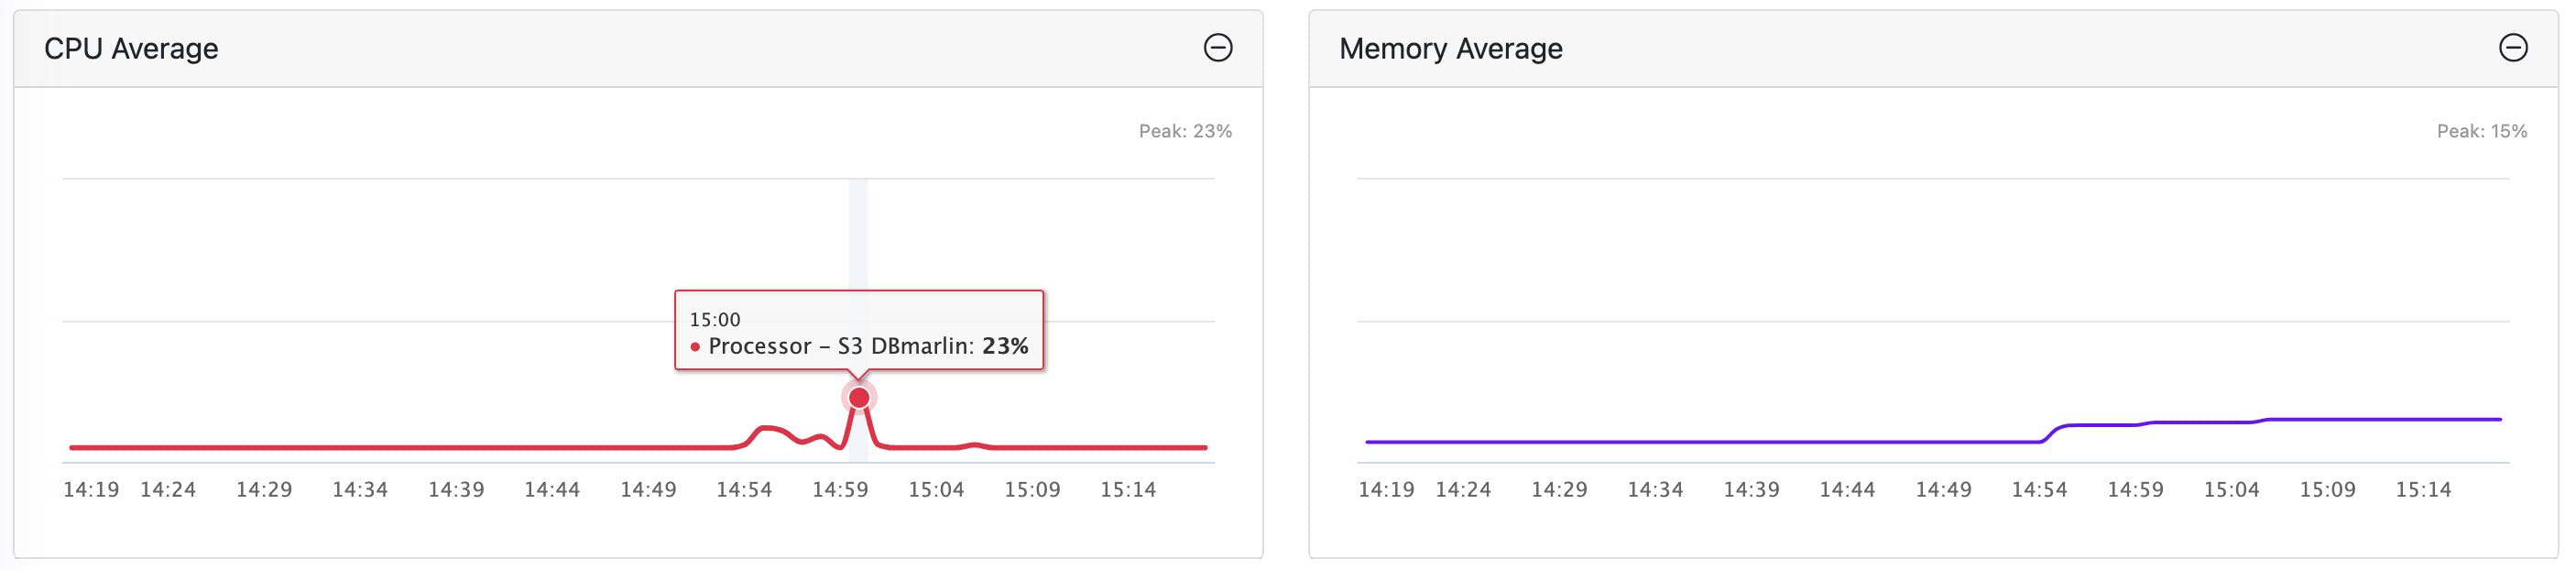
CPU and Memory over time
These charts show the CPU and memory usage over time for any hosts that are linked to this particular database instance.
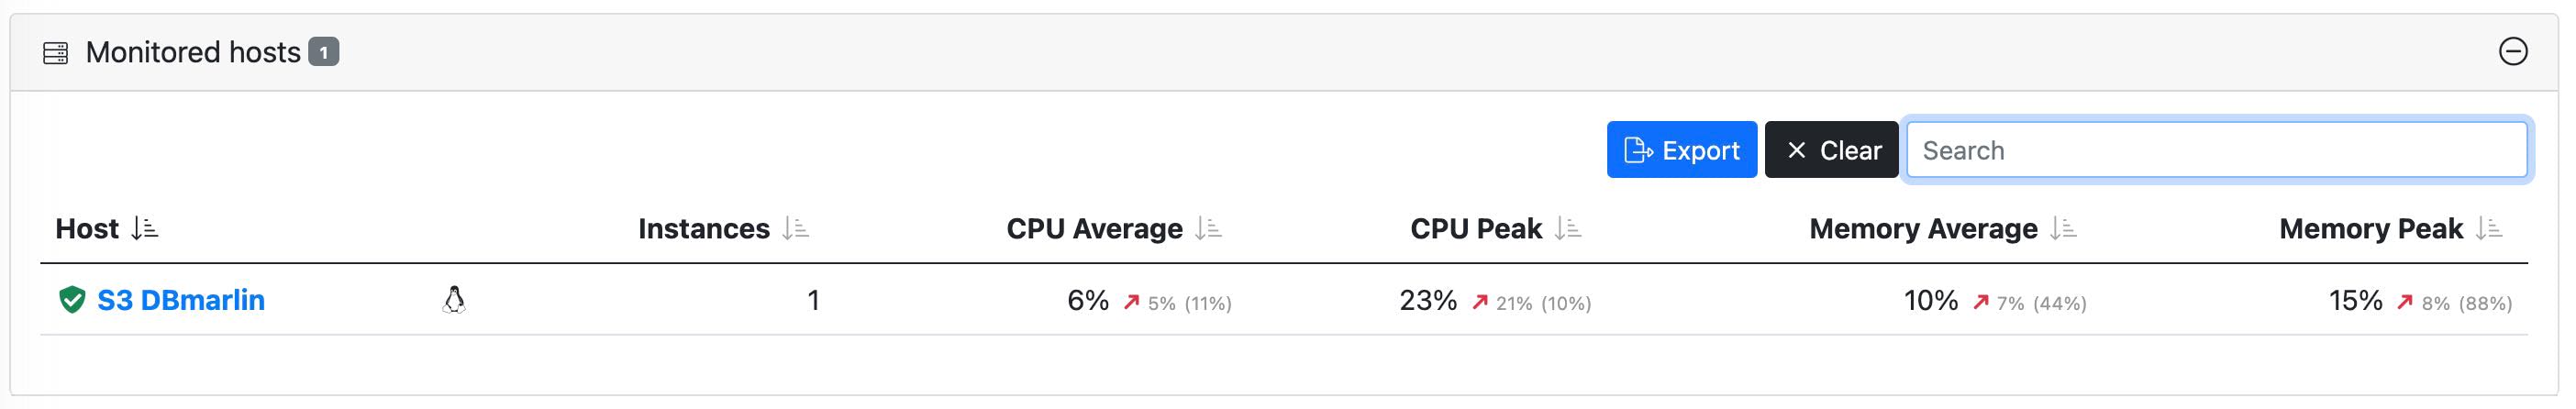
Monitored hosts table
This table show the host metrics for any hosts that are linked to this particular database instance.
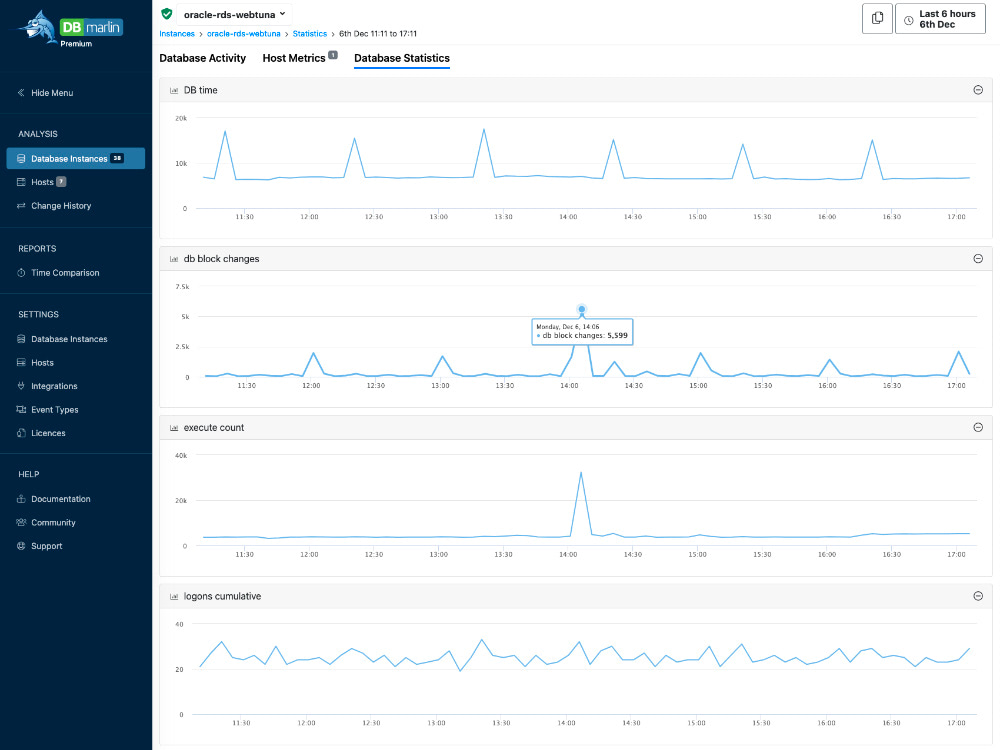
Database Statistics
This screen provides time-series metrics at the database instance or cluster level. These metrics are the key performance metrics for each database platform and contain metrics related to things such as connections, I/O, executions by type, commits, rollbacks, parsing.
These are some of the metrics that are provided for each platform:
MySQL
- Open_files
- Open_tables
- Com_delete
- Com_delete_multi
- Com_insert
- Com_insert_select
- Com_replace
- Com_replace_select
- Com_select
- Com_update
- Connections
- Opened_files
- Opened_tables
- Qcache_hits
- Queries
- Questions
PostgresSQL
- database_size
- numbackends
- blks_hit
- blks_read
- confl_bufferpin
- confl_deadlock
- confl_lock
- confl_snapshot
- confl_tablespace
- tup_deleted
- tup_fetched
- tup_inserted
- tup_returned
- tup_updated
- xact_commit
- xact_rollback
Oracle
- DB time
- db block changes
- execute count
- logons cumulative
- parse count (hard)
- parse count (total)
- parse time cpu
- parse time elapsed
- physical reads
- physical writes
- redo size
- session logical reads
- transaction rollbacks
- user calls
SQL Server
- User Connections
- Batch Requests/sec
- Errors/sec
- Lock Requests/sec
- Lock Timeouts (timeout > 0)/sec
- Lock Timeouts/sec
- Lock Wait Time (ms)
- Lock Waits/sec
- Number of Deadlocks/sec
- Page lookups/sec
- Page reads/sec
- Page writes/sec
- Transactions/sec
- cpucount
- cpuutilisation
- kernelmodetime
- memoryutilisation
- otherprocessutilisation
- pagefaults
- processutilisation
- systemidle
- usermodetime
- workingsetdelta
- Total Server Memory (KB)
- Target Server Memory (KB)
- Free Memory (KB)
- SQL Compilations/sec
- Page life expectancy
- Full Scans/sec
- Page Splits/sec
- Total Latch Wait Time (ms)
CockroachDB
- capacity.available
- capacity.used
- liveness.livenodes
- node-id
- replicas
- sql.conns
- sql.service.latency-p99
- sql.delete.count
- sql.insert.count
- sql.new_conns
- sql.query.count
- sql.select.count
- sql.update.count
- txn.refresh.auto_retries
IBM Db2
- APPLS_CUR_CONS
- APPLS_IN_DB2
- CONNECTIONS_TOP
- COORD_AGENTS_TOP
- APP_RQSTS_COMPLETED_TOTAL
- DEADLOCKS
- DYNAMIC_SQL_STMTS
- FAILED_SQL_STMTS
- LOCK_WAITS
- LOCK_WAIT_TIME
- SELECT_SQL_STMTS
- STATIC_SQL_STMTS
- TOTAL_CONS
- cpucount
- cpuutilisation
- totalmemory
- memoryused
- memoryutilisation
- total_cpu_time
- total_section_proc_time
- total_section_sort_proc_time
Informix
- activesessions
- btradata
- btraidx
- buffwts
- bufreads
- bufwrites
- chunkwrites
- ckptwts
- compress
- deadlks
- disksorts
- dpra
- dskreads
- dskwrites
- executions
- fgwrites
- flushes
- idlesessions
- isamtot
- iscommits
- isdeletes
- isopens
- isreads
- isrewrites
- isrollbacks
- isstarts
- iswrites
- latchwts
- lktouts
- ll_bfwait_ms
- ll_iowait_ms
- ll_nbfwaits
- ll_niowaits
- llgpagewrites
- llgrecs
- llgwrites
- lockreqs
- lockwts
- lruwrites
- maxconnections
- maxsortspace
- memsorts
- num_cpu_ready
- num_ready
- numckpts
- ovlock
- ovtrans
- ovuser
- pagreads
- pagwrites
- plgpagewrites
- plgwrites
- rapgs_used
- seqscans
- totalsorts
SAP HANA
- activesessions
- commit_count
- compilation_count
- current_commit_rate
- current_compilation_rate
- current_execution_rate
- current_memory_usage_rate
- current_rollback_rate
- current_transaction_rate
- current_update_transaction_rate
- execution_count
- executions
- idlesessions
- maxconnections
- peak_commit_rate
- peak_compilation_rate
- peak_execution_rate
- peak_memory_usage_rate
- peak_rollback_rate
- peak_transaction_rate
- peak_update_transaction_rate
- rollback_count
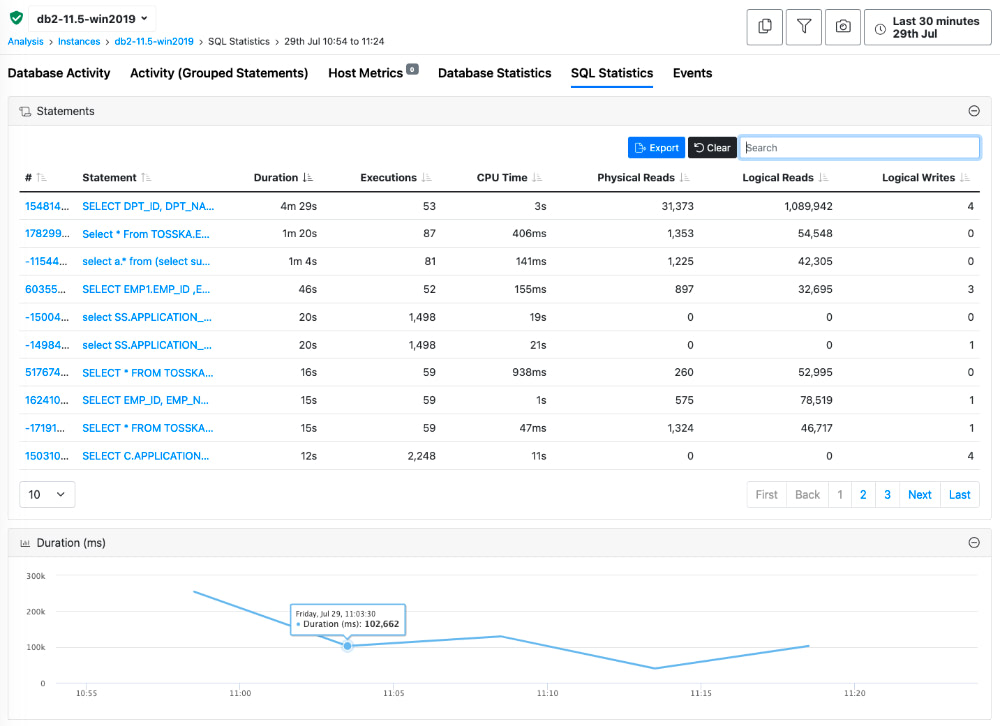
SQL Statistics
This screen provides more statistics at the SQL Statement level such as CPU time, Physical Reads, Logical Reads and Logical Writes. It is available for Oracle, SQL Server, IBM Db2, PostgreSQL 13 and above, MySQL and CockroachDB 21.2 and above.
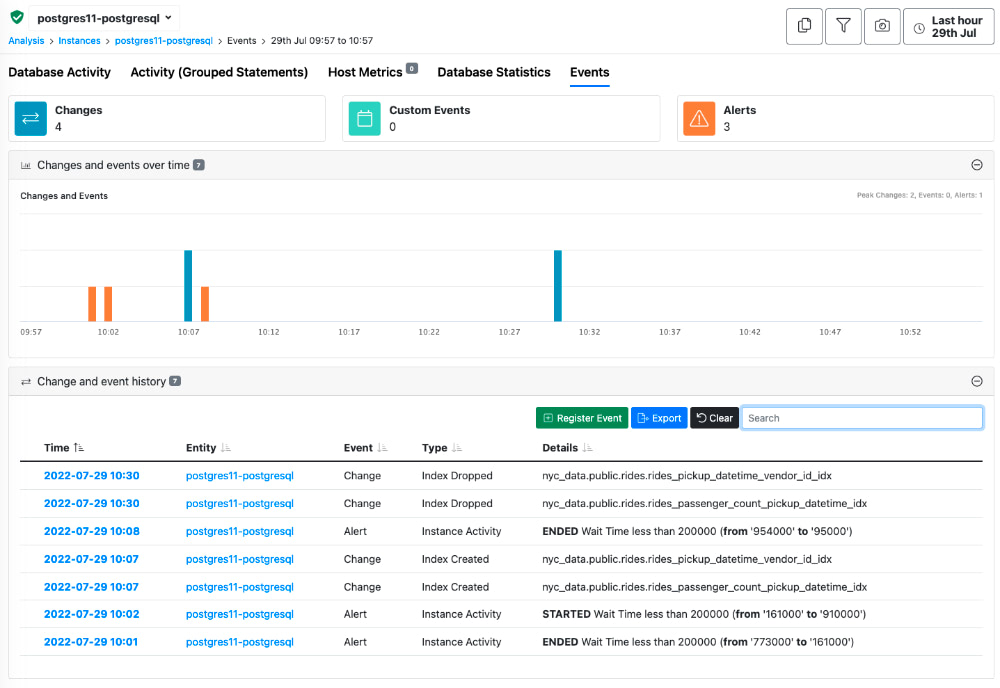
Events
The screen shows any events (Changes, Custom events or Alerts) for the selected instance.
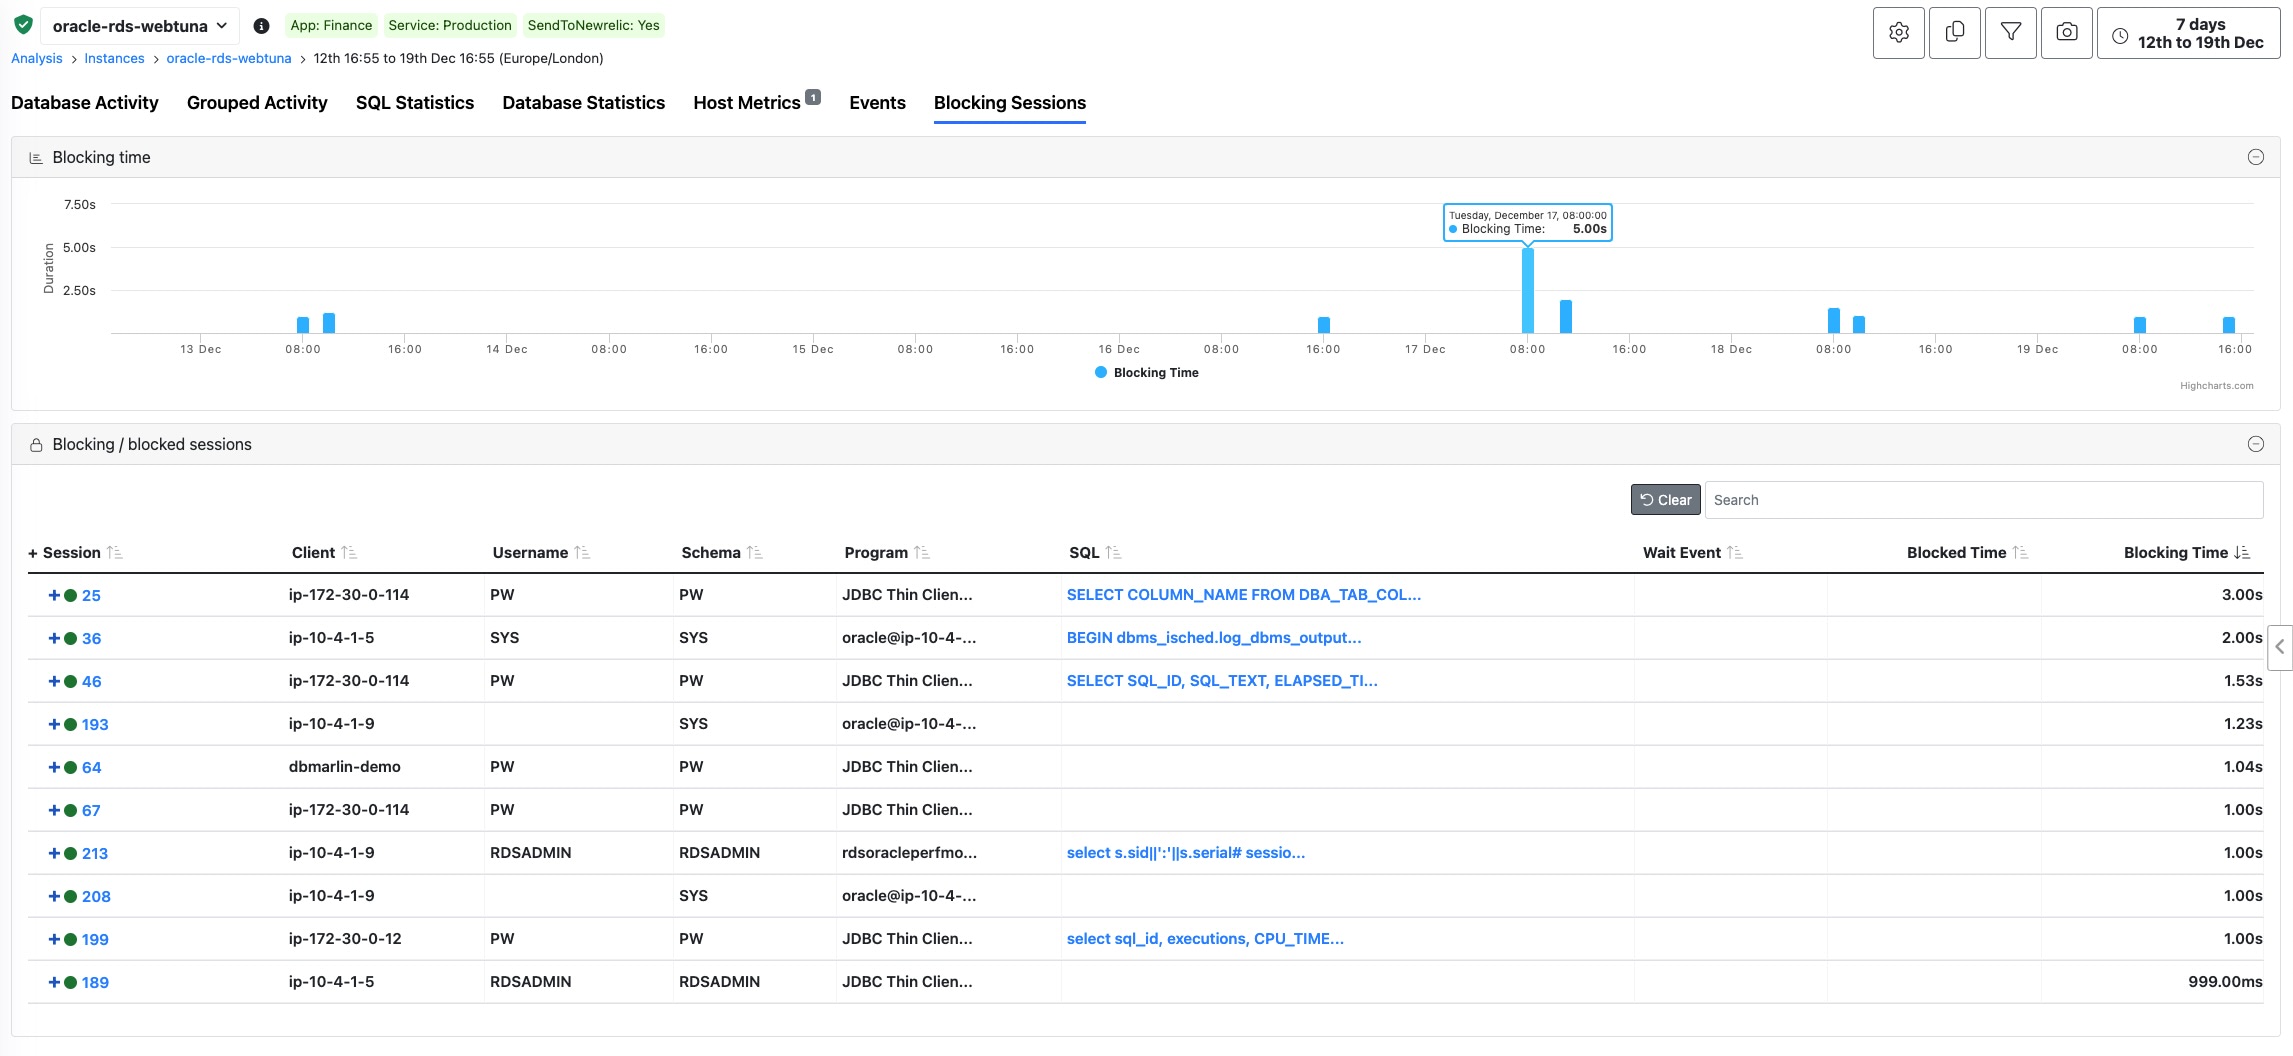
Blocking Sessions
Blocking sessions screen is not available for CockroachDB, instead see Transaction Contention below.
The blocking sessions tab shows the sessions which had held locks during the selected period. The top level shows the blockers with a green dot next to the session ID which indicates that they themselves were a blocker but where not blocked. Clicking the '+' icon to expand the tree will show further sessions with a red dot indicating that they were blocked by the session higher up the tree. Those sessions may in turn, be blocking other sessions.
The columns show the Session ID, Client IP, Username, Program and which SQL Statement they were running when they were blocked. It also shows the lock wait event that they were waiting on and the amount of time they were blocked for. Clicking on the Session ID will take you to a historical view of that session. Clicking on the SQL Statement will take you to a historical view of that statements performance. And clicking on the wait event name will take you to the knowledge-base where you can read more about the wait event and what can be done to reduce it.
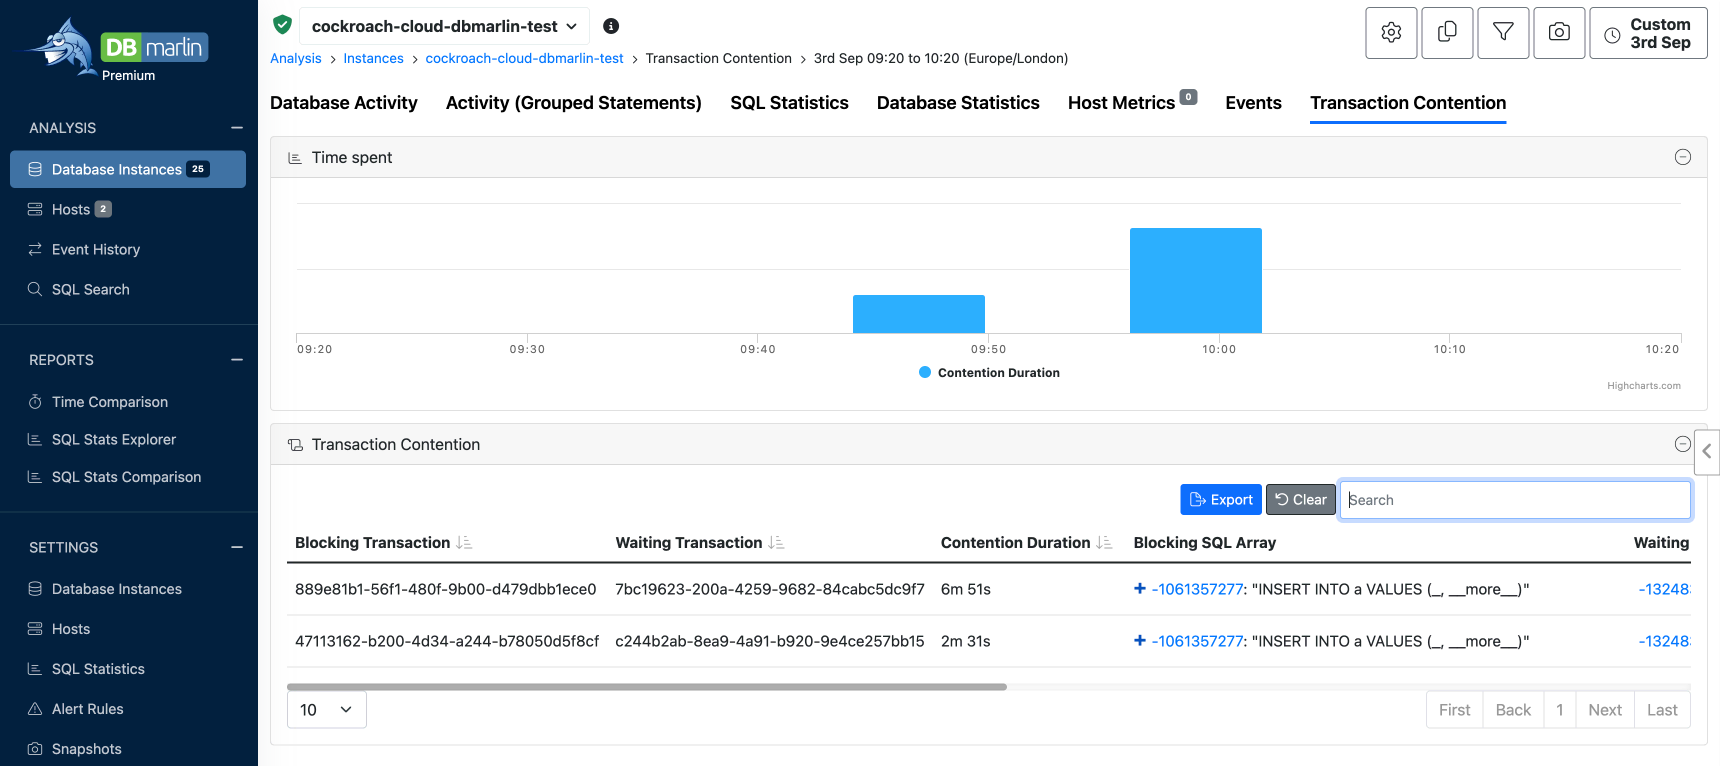
Transaction Contention
Transaction Contention capture is only available for CockroachDB 23 and above.
This screen shows a list of transactions that caused contention and the transactions that they were blocking. For each contention event you can see the duration the contention lasted for and the Blocking SQL array and Waiting SQL array. Note that in some cases the array may just contain a single SQL Statement. Next to the SQL statements in each array you will find a link to the Statement details screen for that statement where you can see SQL Activity, SQL Statistics and Execution Plans if there were any.
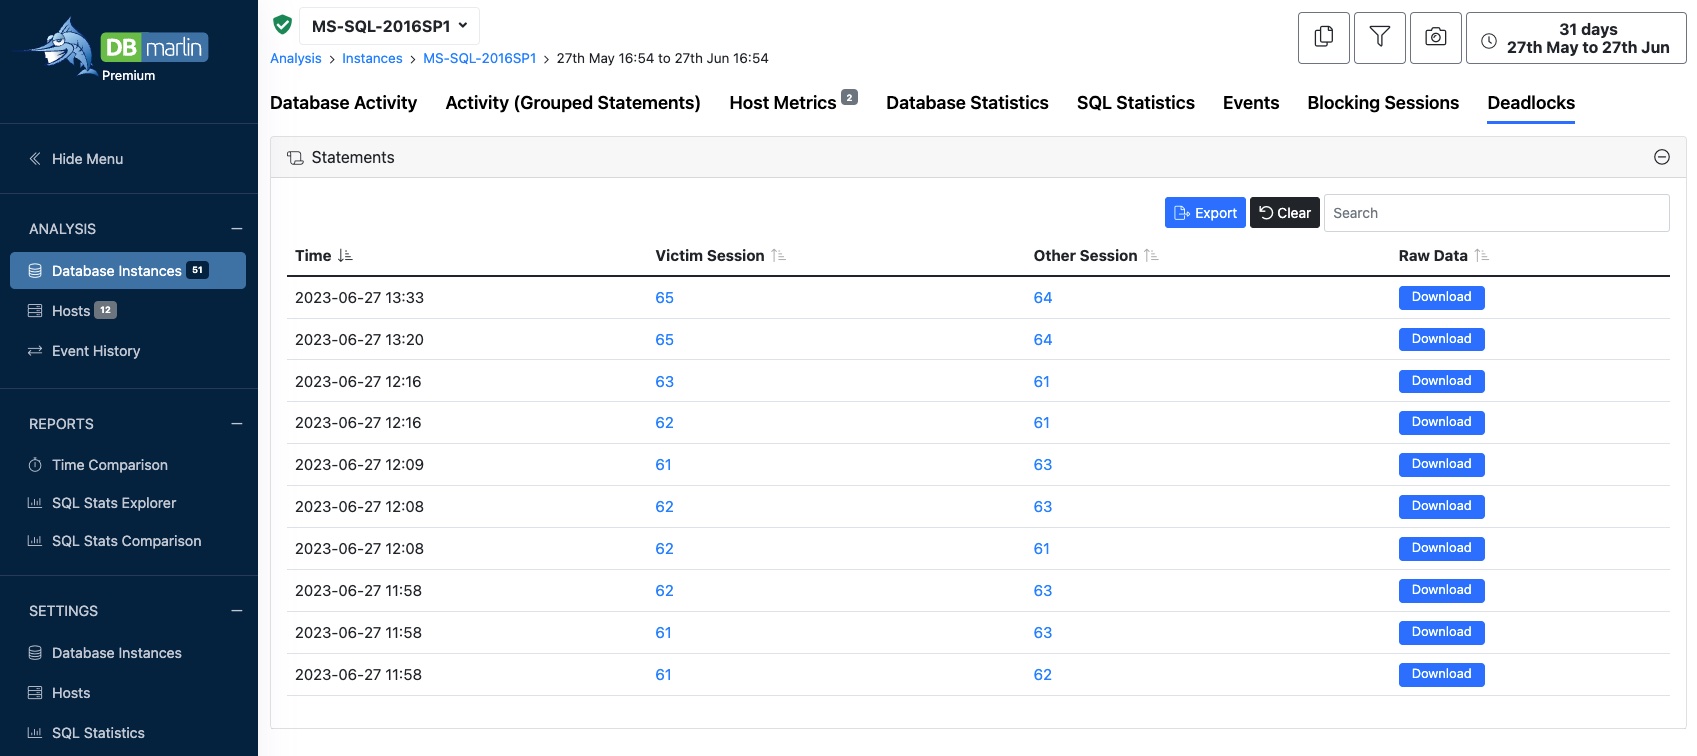
Deadlocks
Deadlock capture is only available for SQL Server and Oracle.
A database deadlock occurs when two or more transactions or processes within a database system are waiting for each other to release resources, resulting in a state of mutual deadlock where none of the transactions can proceed. This situation can lead to a system freeze or significant performance degradation. DBmarlin captures the deadlock events as well as the sessions involved to help remediate the problem. Clicking into the session id will take you to the Activity screen filtered on that session id. The download button will download an XML file with the full details of the deadlock.
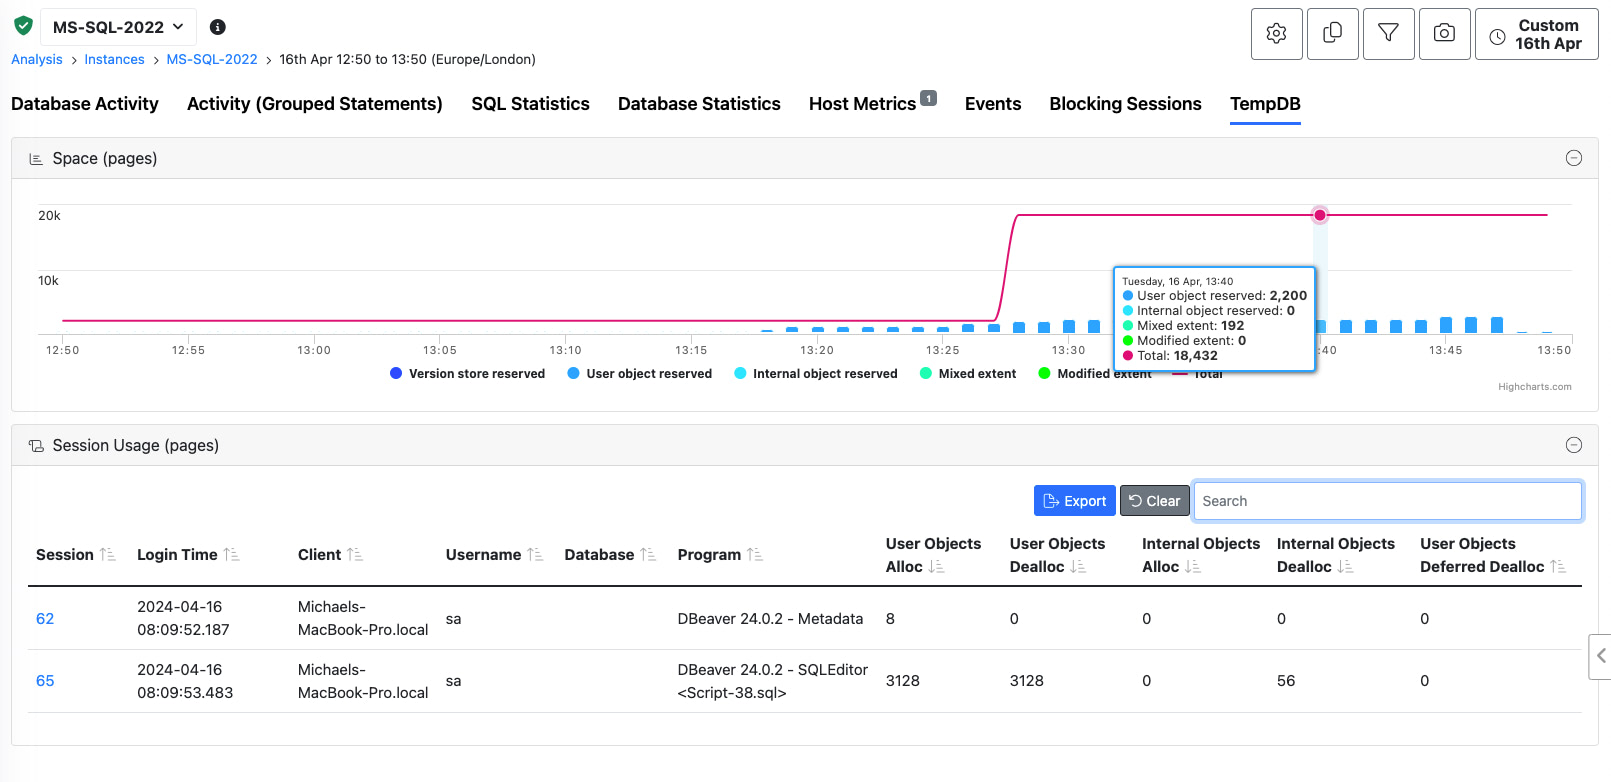
TempDB
TempDB monitoring is a SQL Server only feature and is available for SQL Server 2014 SP2, 2016 SP2 and later versions.
tempdb is a system database in SQL Server that is crucial for several reasons. It serves as a temporary storage area for all sorts of operations and processes, and its performance can significantly impact the overall functioning of the server. Here are some of the key roles and uses of tempdb:
- Temporary Storage:
tempdbholds temporary user objects such as temporary tables and stored procedures, temporary indexes, and other objects created by users during SQL operations. - Internal Object Usage: SQL Server uses
tempdbfor internal objects like work tables for sorting or processing queries, intermediate results for queries, and spooling in query execution plans. - Version Store: It is used for row versioning that facilitates features like snapshot isolation and read-committed snapshot isolation levels. This allows multiple versions of data to be available for transactions, which is crucial for managing concurrency without locking.
- Space Management:
tempdbhandles space allocation for user objects and internal objects, which can grow dynamically depending on the workload. Proper management of the space intempdbcan help in avoiding system slowdowns or failures. - Caching and Buffering: It acts as a cache for certain session-level objects and operations, speeding up operations and reducing the workload on more permanent databases.
- Global Temporary Tables:
tempdbstores global temporary tables and procedures that are available to any user and any connection once they are created.
Due to its importance in the operation and performance of SQL Server, managing tempdb efficiently is crucial. This includes ensuring that it is sized appropriately, configured for optimal disk I/O performance, and monitored to prevent and address issues like contention or excessive space usage. Effective management of tempdb can help in achieving better performance and stability of SQL Server operations.
DBmarlin shows the following tempdb metrics over time for any period:
- Version store reserved
- User object reserved
- Internal object reserved
- Mixed extent
- Modified extent
- Total
DBmarlin also shows which sessions are consuming tempdb space and the number of each type of object the session has allocated or deallocated.
Parameters
Parameters screen was added in DBmarlin v5.1
The Parameters screen lets you see all the database parameters/settings (or cluster settings in the case of CockroachDB) for the database instance you have selected. You can filter the list using the search or export the list of parameters.
Also see the Parameter Comparison Report to compare parameters across instances or across time ranges.
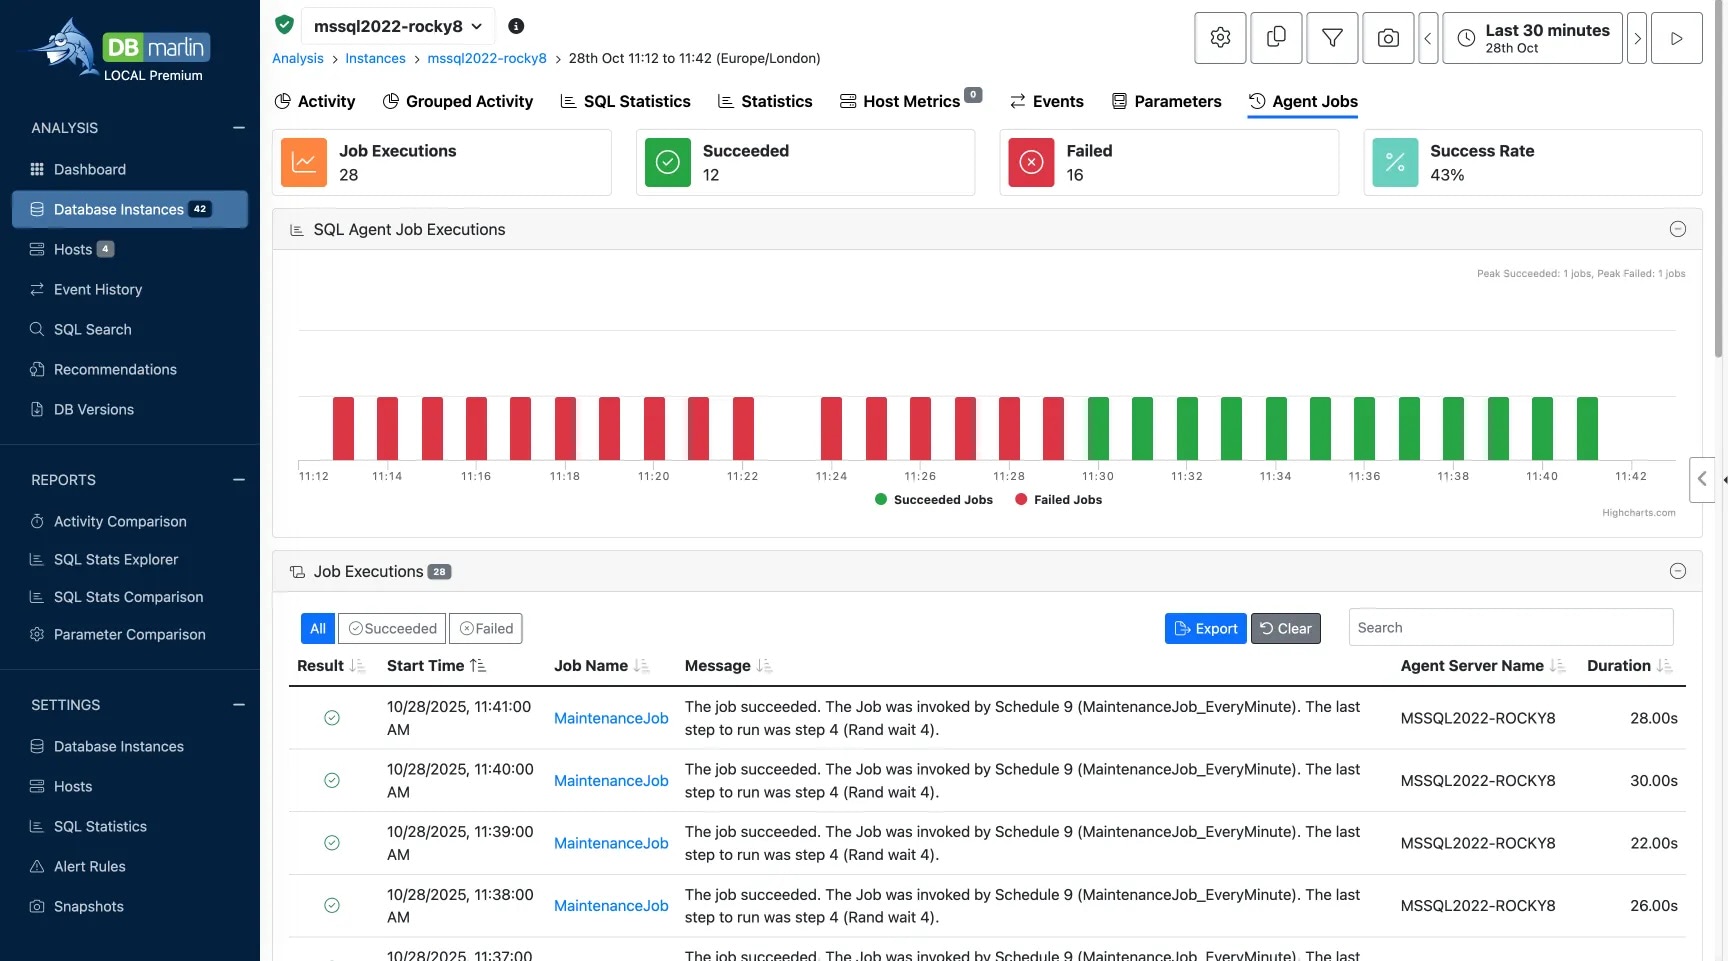
Agent Jobs
Agent Jobs screen was added in DBmarlin v5.10
This is available for SQL Server only and requires that 'Collect Job History' is enabld in the Advanced Database instance settings screen.
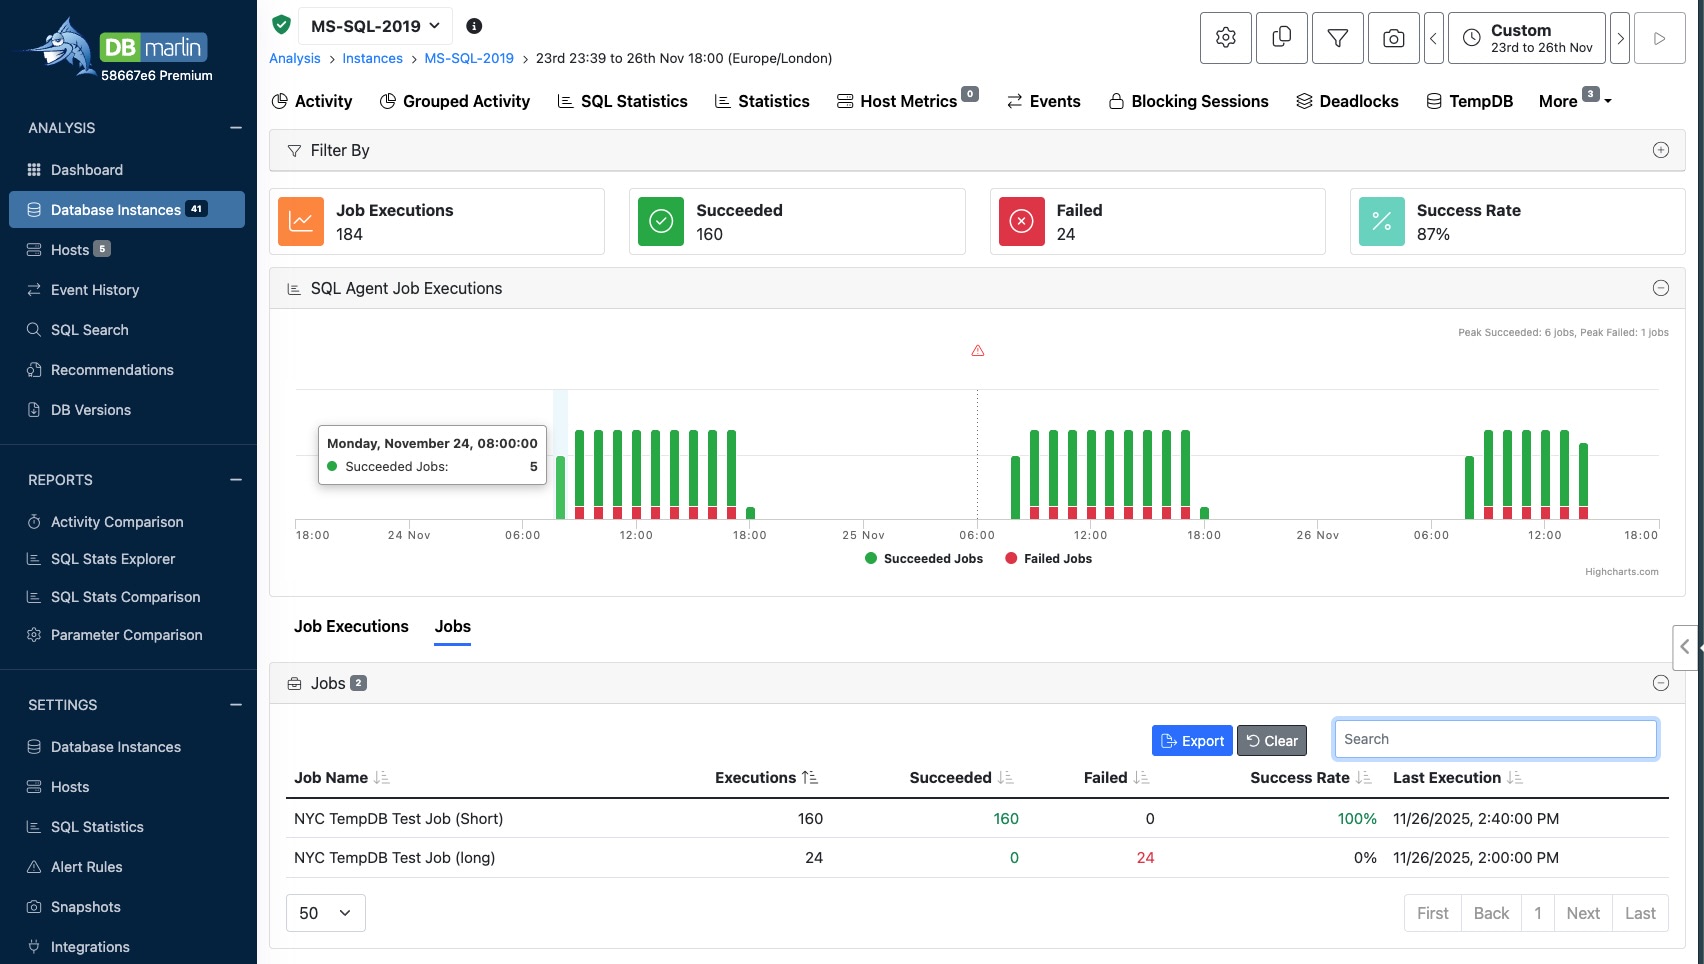
The screen shows a list of any SQL Agent Jobs that have executed within the selected time range. Note that the Job Exection time shown is the Start of the Job exectuion and so the time range selected must include the time when the job started. For each Job execution you can see whether it suceeded or failed and how long it took to run. Clicking on the Job name links to a slide out panel with more details about the Steps within the Job and you can the Steps that succeeded or failed and how long each Step took.
You can also see Jobs rolled up by Job name. This is useful for seeing the overall performance and success rate of each Job over the selected time range.
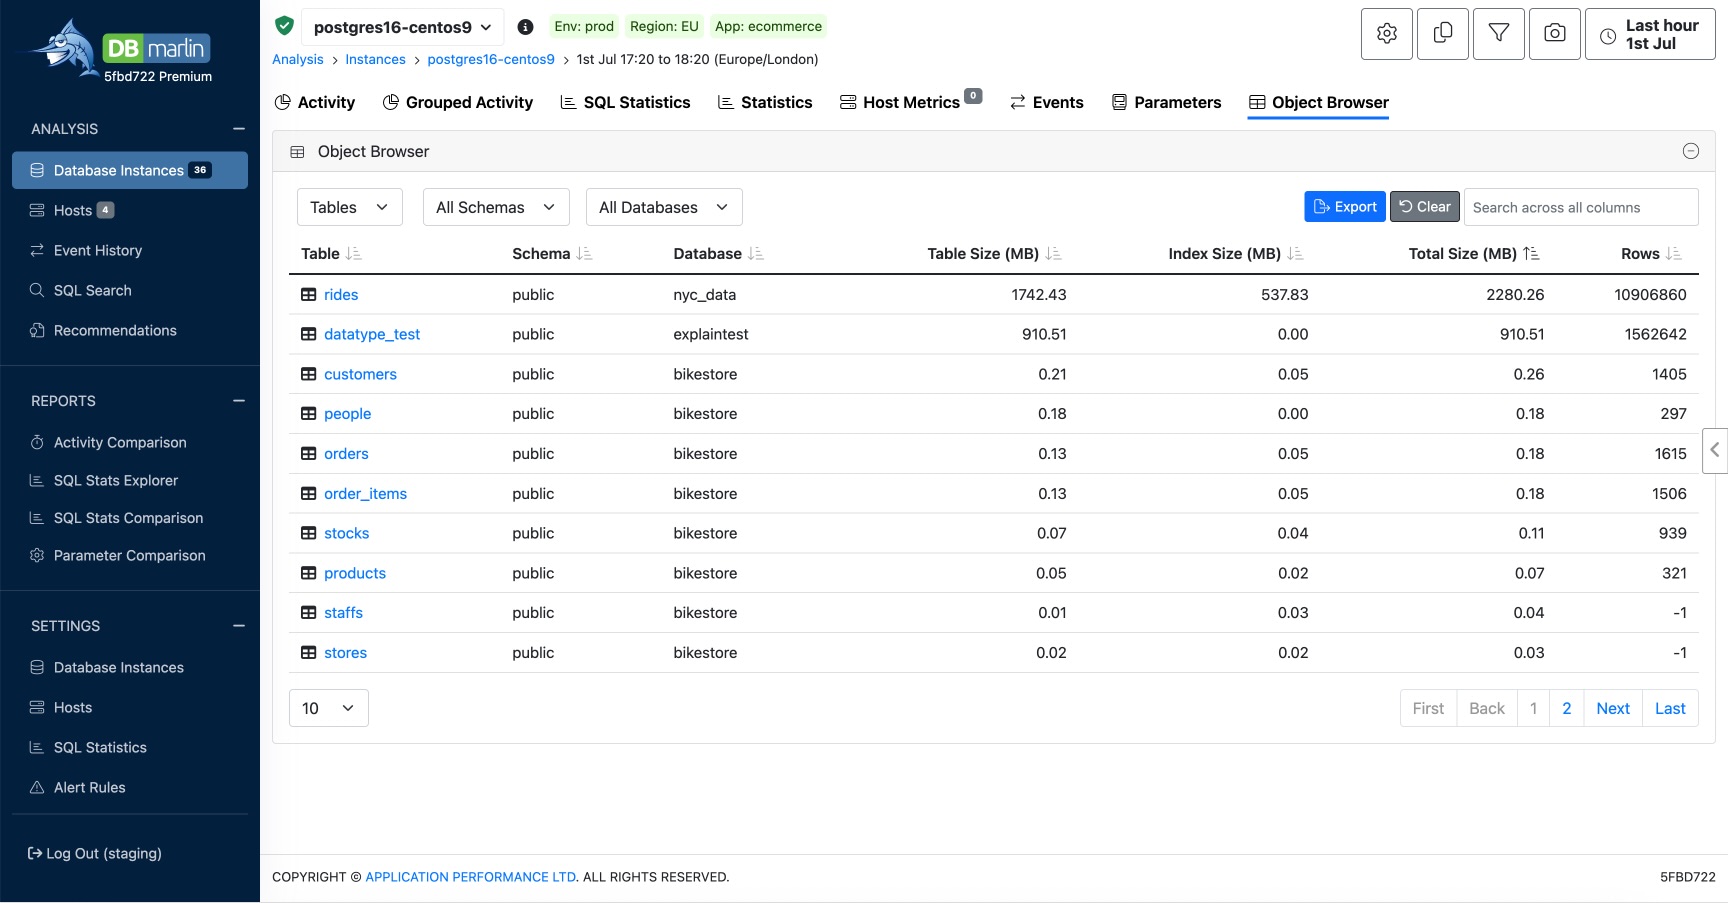
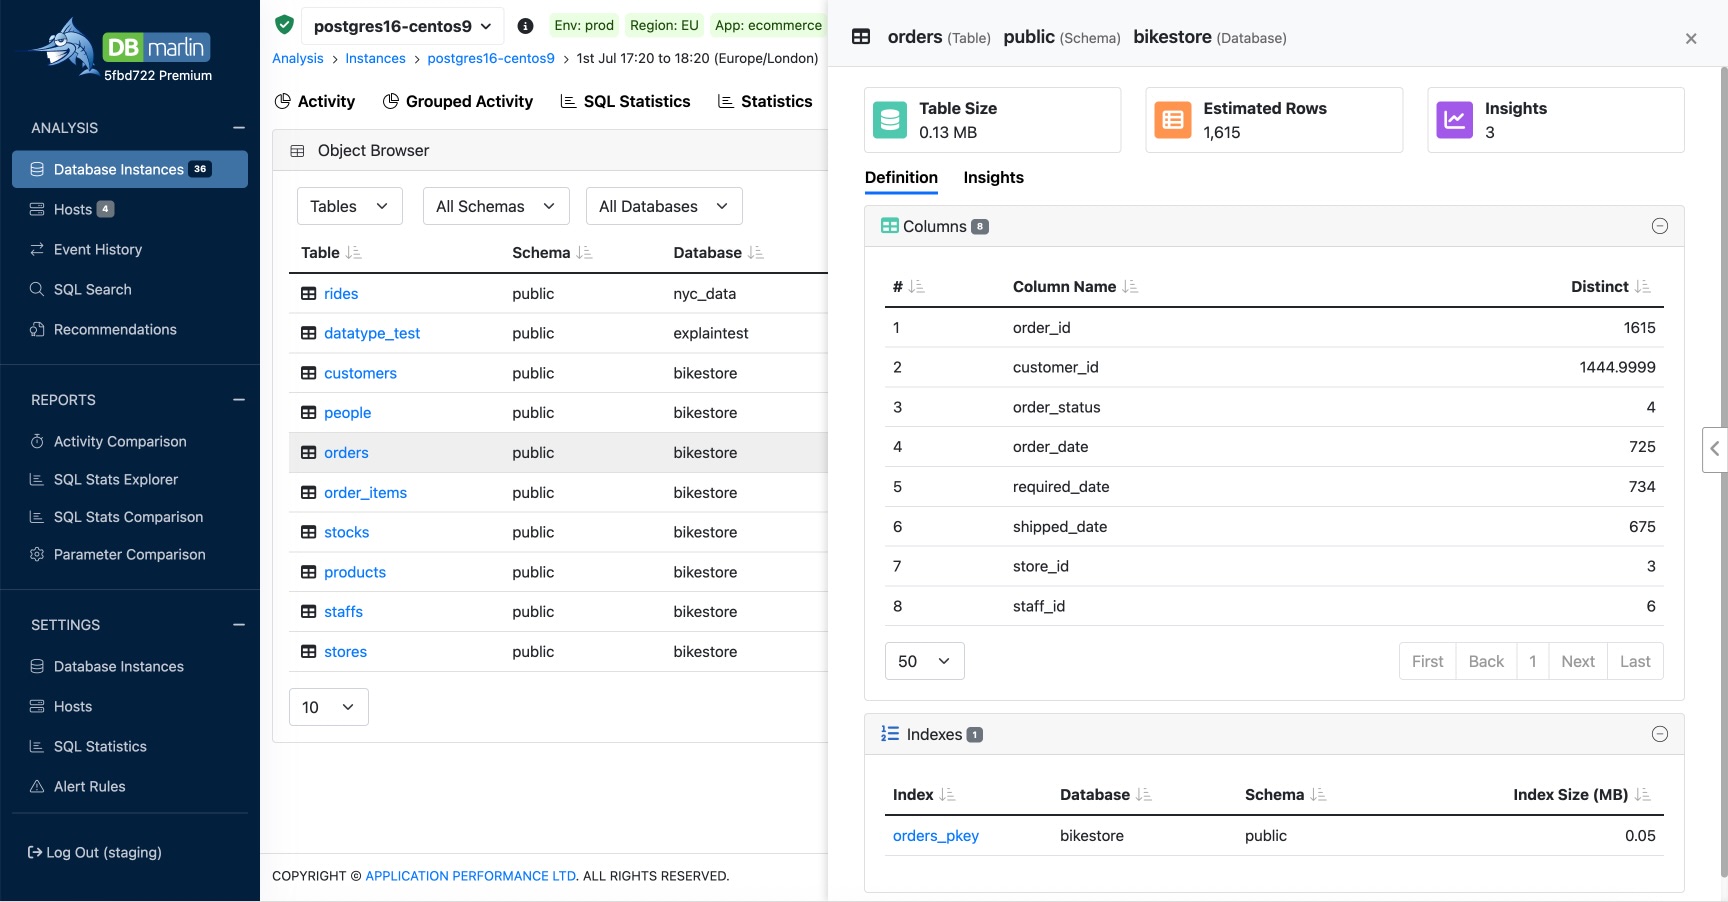
Object browser
Object browser is currently available for MySQL, PostgreSQL, MariaDB, Oracle and SQL Server. Collection must be turned on under Advanced mode in Instance Settings.
The main object browser screen lets you see tables or indexes in a tabular view. You can filter by database or schema name and sort by any of the columns such as Size (MB) or number of rows. The table statistics come from the database and will require that the tables have been analyze using the apporpriate ANALYZE command for the database type.
Clicking on a table or index will reveal the slide out panel with the object Definition and Insights. The Definition tab shows the columns in the table and their datatypes. For tables it will show any indexes and for an index it will show the base table and these are hyperlinked so you can navigate from table to index and back again.
The object browser slide out panel is also avaialble from the Explain plan screen by clicking on a table or index.