Multi-level drilldown
Multi-level drill down allow you filter the data in DBmarlin to the things most of interest.
Filter bar
The filter bar appears at the top of the screen showing which filters you have applied. In the example below you can see we are filtered on Database, Client, User and Program.

Applying filters
You can filter on the following entities by by clicking on their name in the table in the lower tabs of the Instance dashboard or on their name or corresponding segment in the donut charts.
- Database/Schema
- Session
- Client
- User
- Program
- Wait
After adding your first filter, you can switch to another tab or another donut chart and continue to add further filters.
Clearing filters
You can clear filters using the Filter bar. There is a Clear button to clear all filters or you can clear Individual filters by clicking on them.
Note that as you change screen the filters are retained and so you might need to clear them if you switch to a different database instance where the filters are not relevant, otherwise you will see no data as it is all filtered out.
Understanding filtered data
In the screen below you can see that the data has been filtered by looking either at the Filter bar or the coloured badge showing the count next to the tab headings.
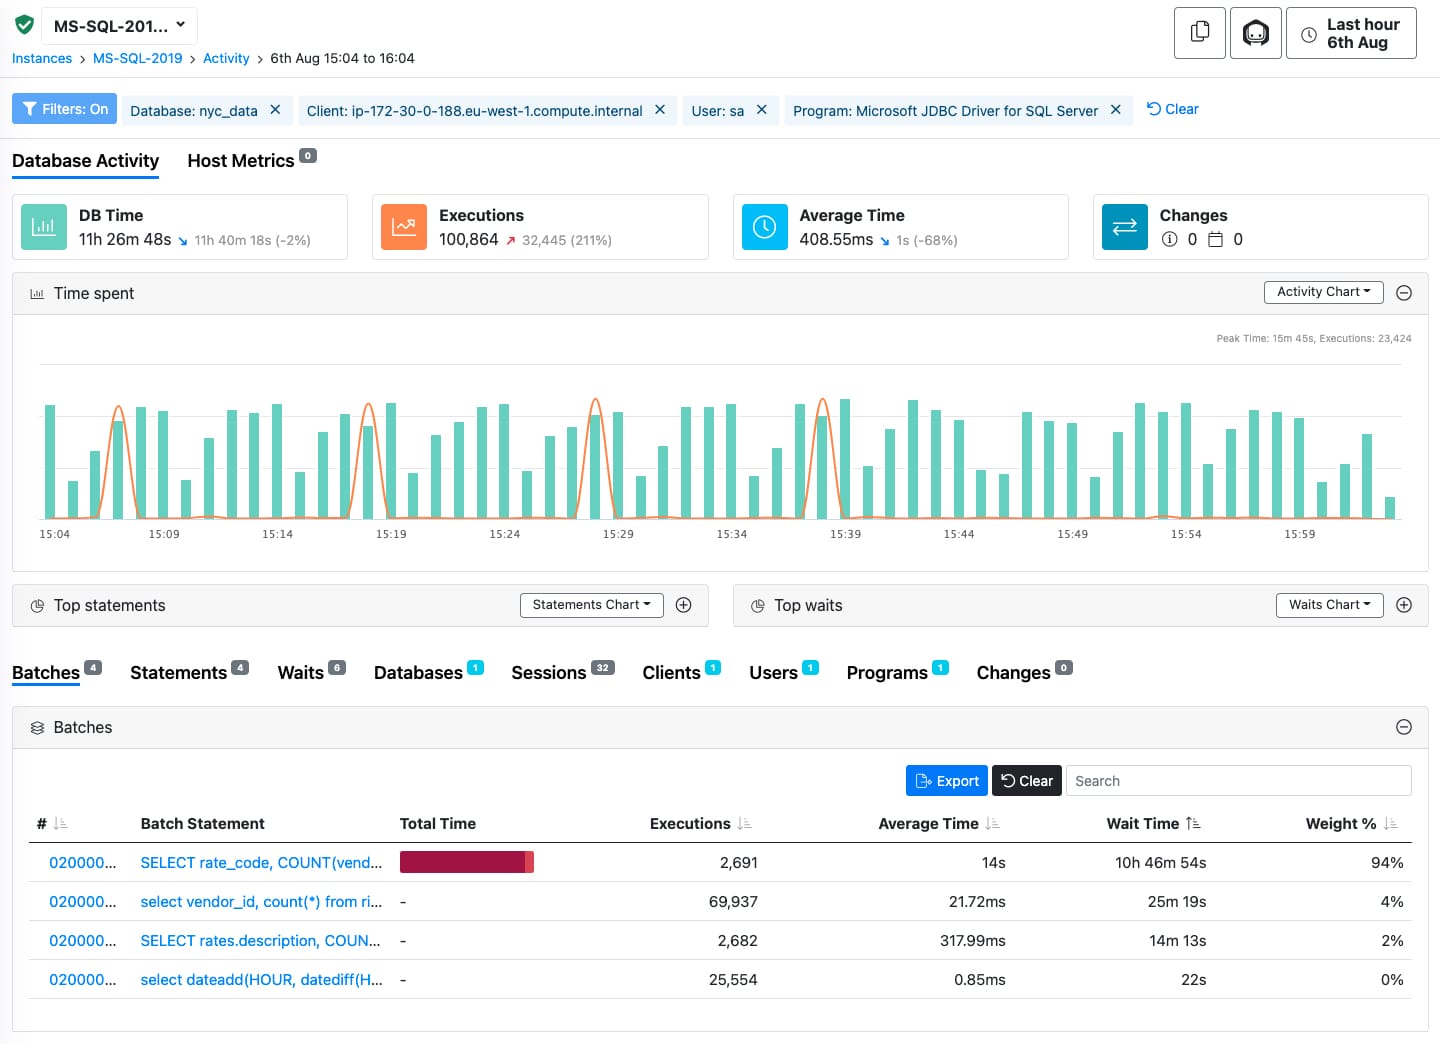
When a filter is applied all widgets on the screen are updated to apply the filter.
Note that the Executions widget at the top of the screen will show instance level execution count when no filters are applied. Once you add a filter the Executions widget will then show only the executions for the SQL statements that were sampled by the DBmarlin sensor. This figure could be a lot lower than the instance level figure if you have a lot of internal queries or queries which are very fast and therefore not sampled.