SQL View
The SQL view provides all the details of an individual SQL statement, split over 3 tabs:
- Statement and Plans - shows the full SQL text and any execution plans.
- Statement activity - shows activity over-time for the individual statement.
- SQL statistics - shows SQL statistics over-time for the individual statement.
Statement and Plans tab
The top half of the screen shows the full SQL statement text. The lower half shows the execution plan(s) (if there are any). The horizontal splitter can be dragged to give more space to either the text or the plan as required.
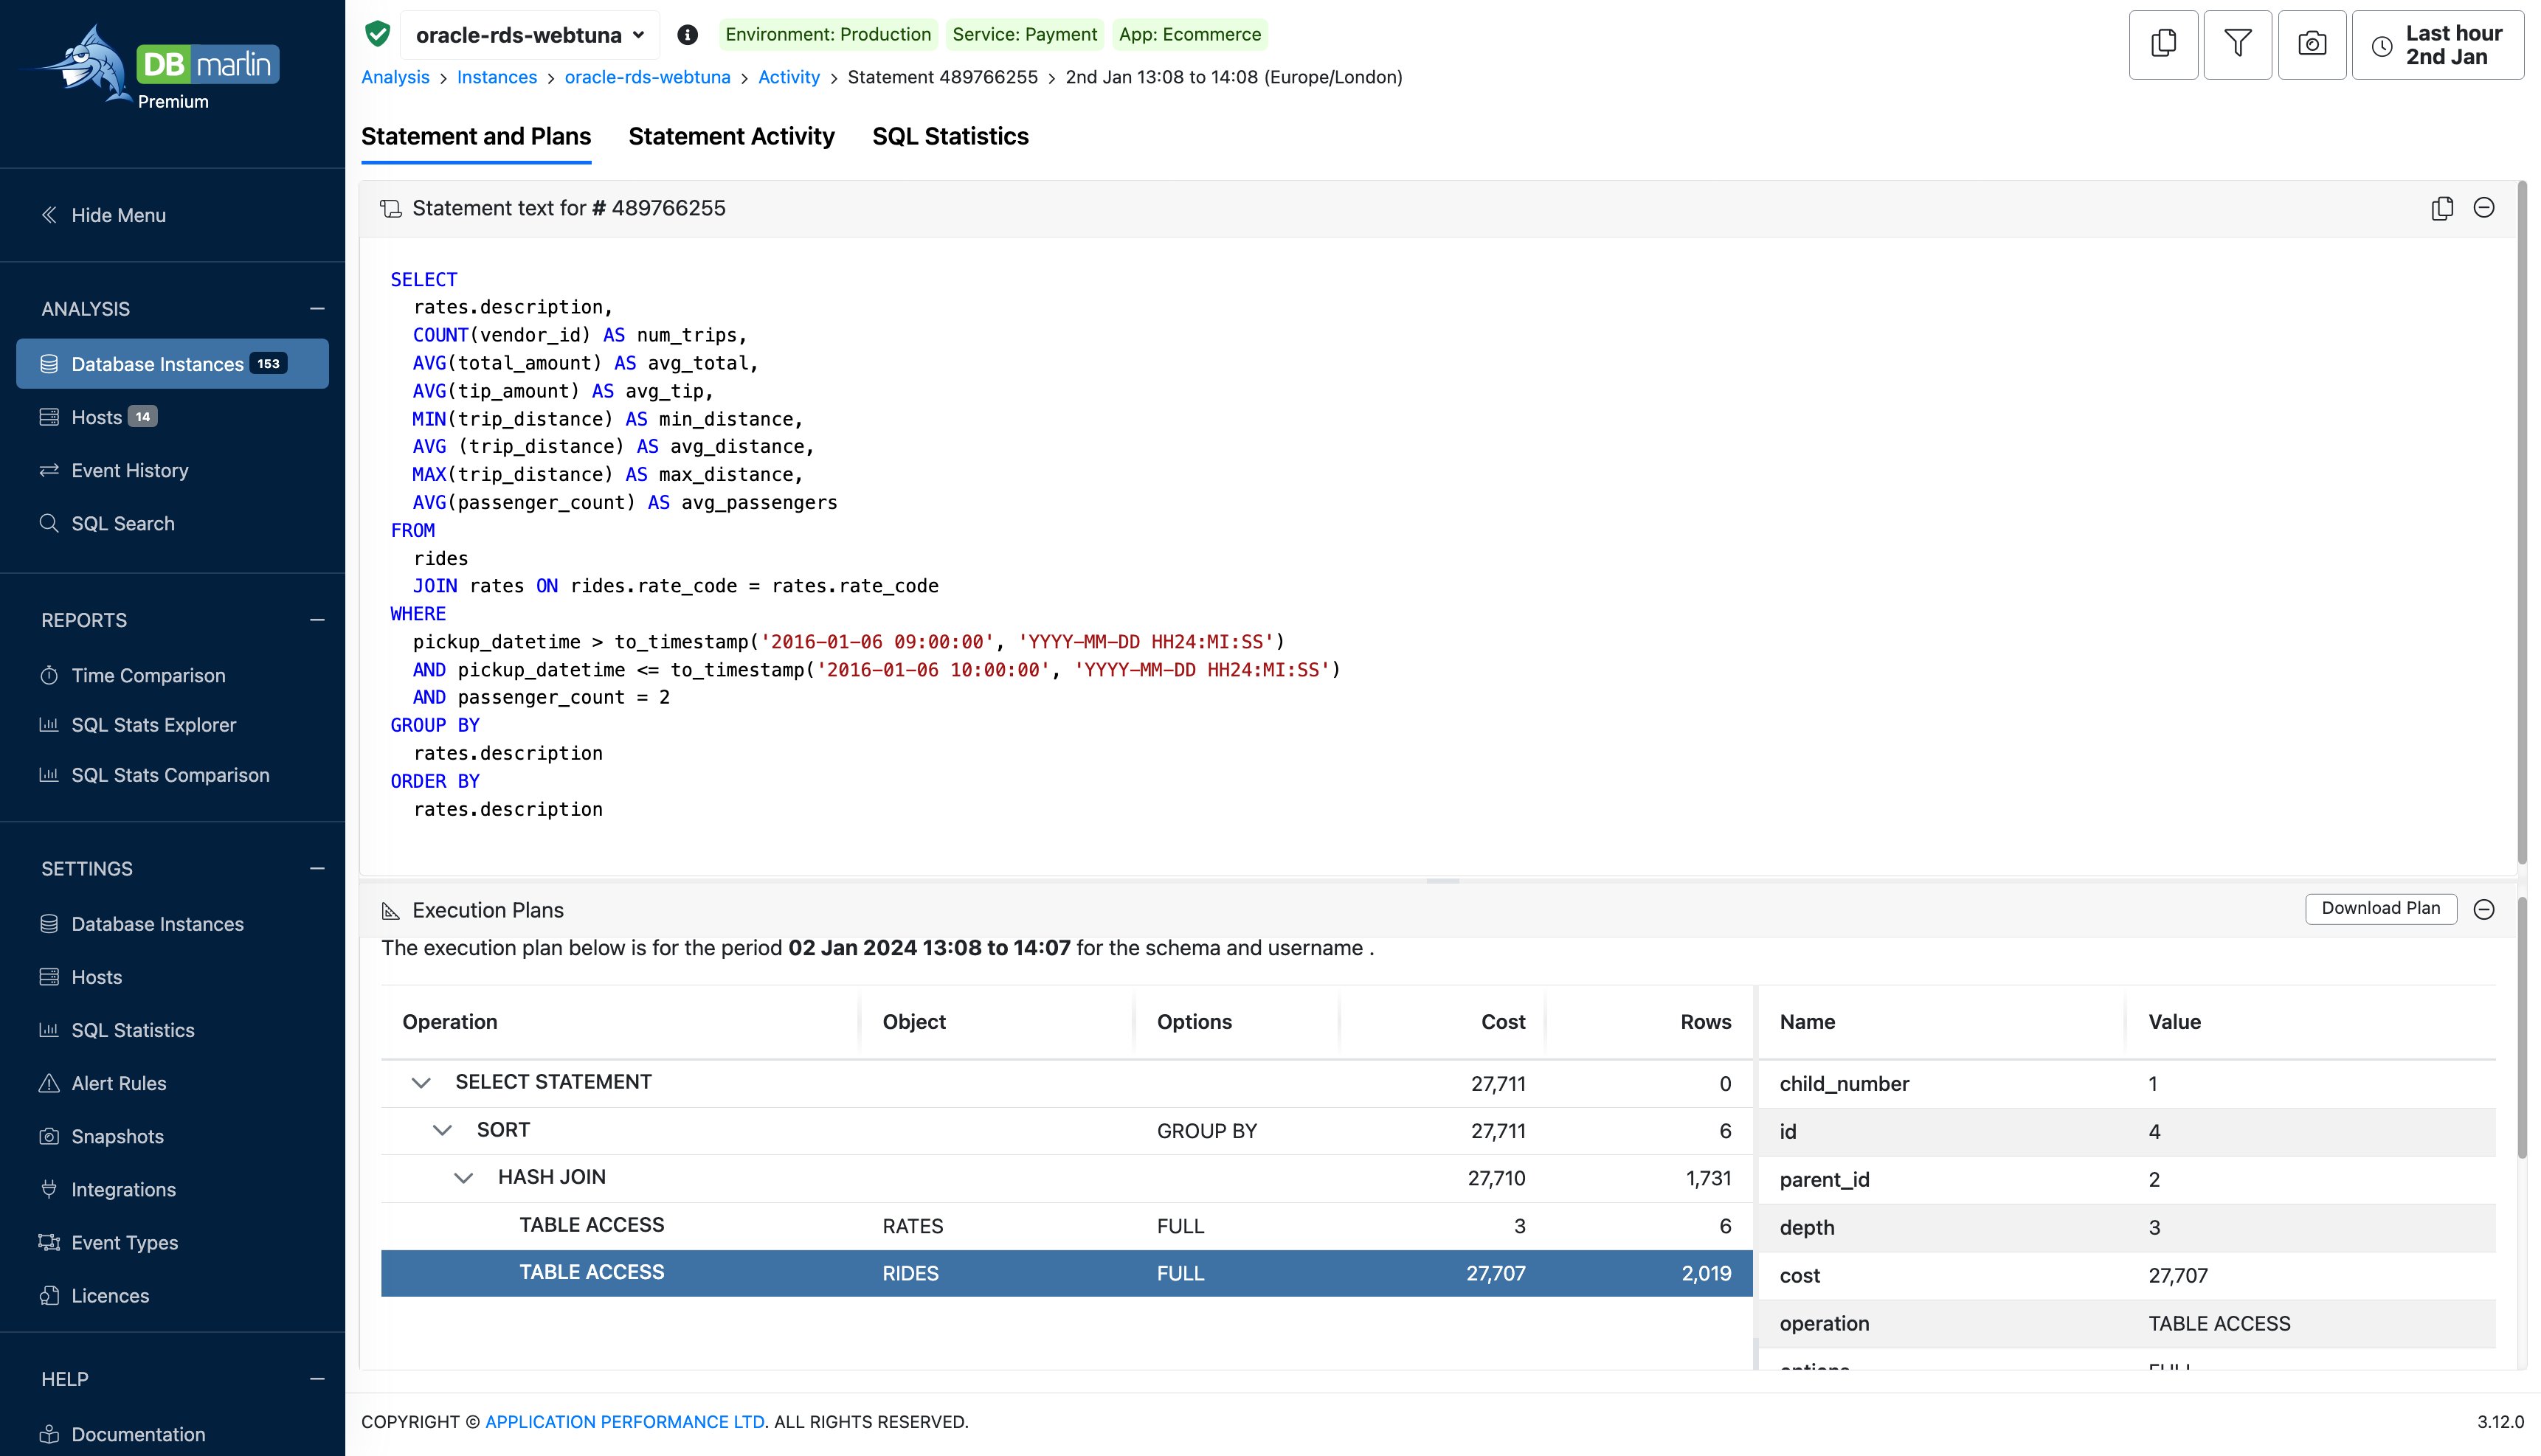
Execution Plans
If the SQL statement had multiple explain plans within the selected period you will see a dropdown where you can toggle between the different plans and see what changed. Note that the the time range when a plan was used represents the earliest and latest times that plan was used. So if a new plan was used for a short period, before reverting to the original, then the plan time ranges overlap.
Explain plans are generated automatically by DBmarlin as a background process. When you have many SQL statements only the top statements will get explained each time it runs.
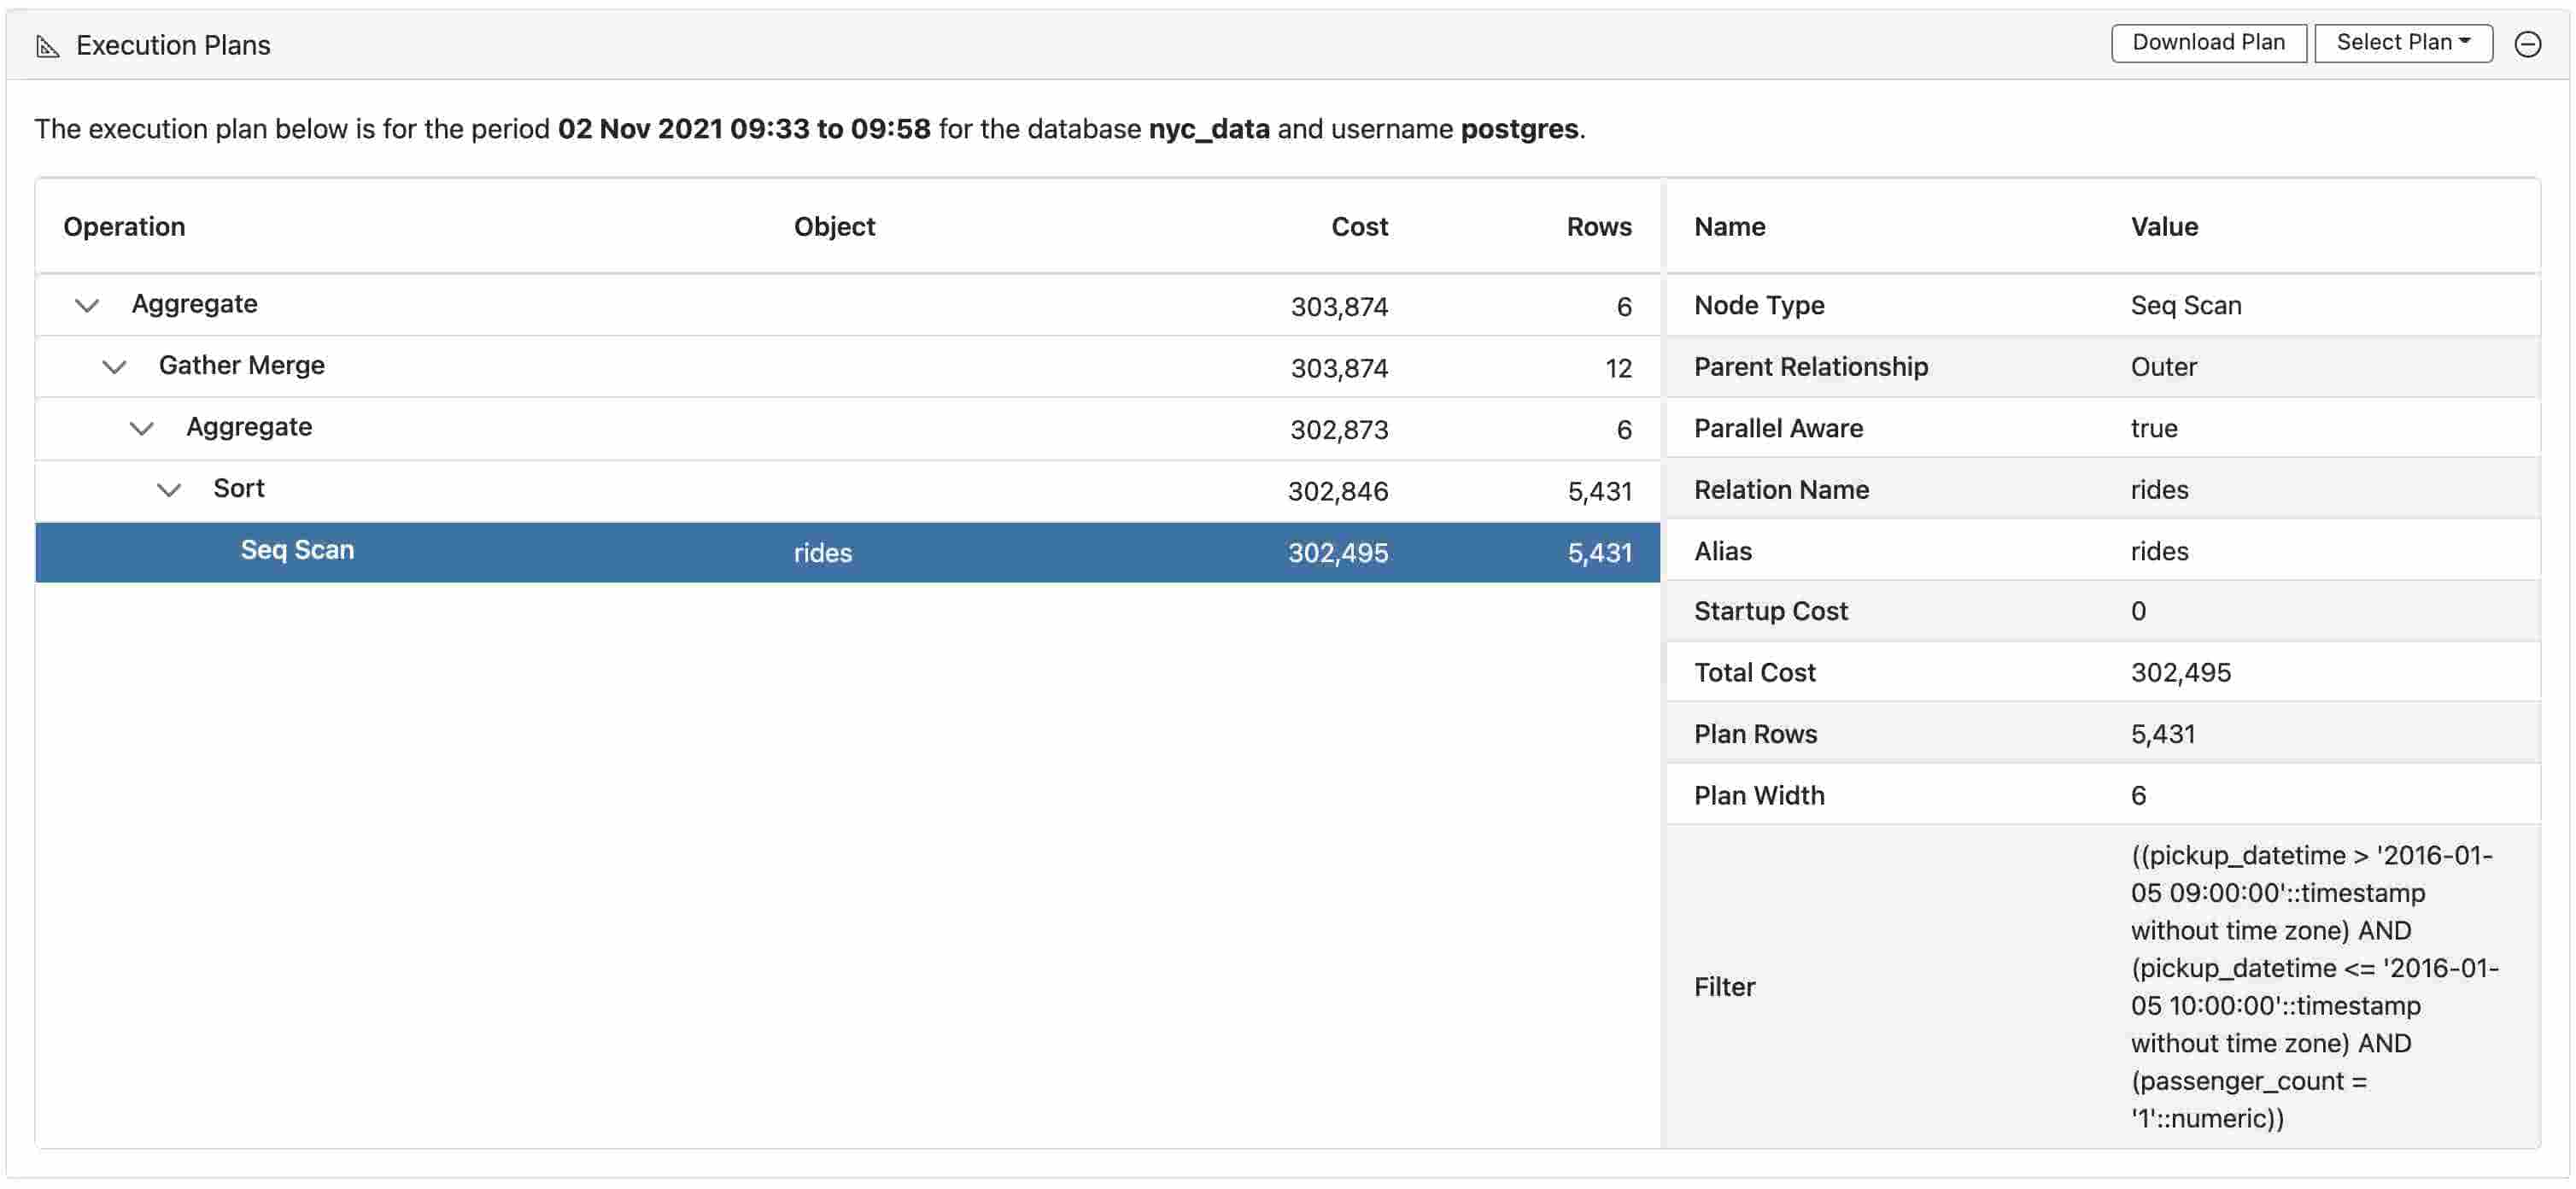
The plan format for Oracle, PostgreSQL, MySQL, IBM Db2 and CockroachDB is a tree view with master detail like below.
The execution plan for CockroachDB might be in plain text format since JSON plans aren't always available so we get a text-based plan instead.
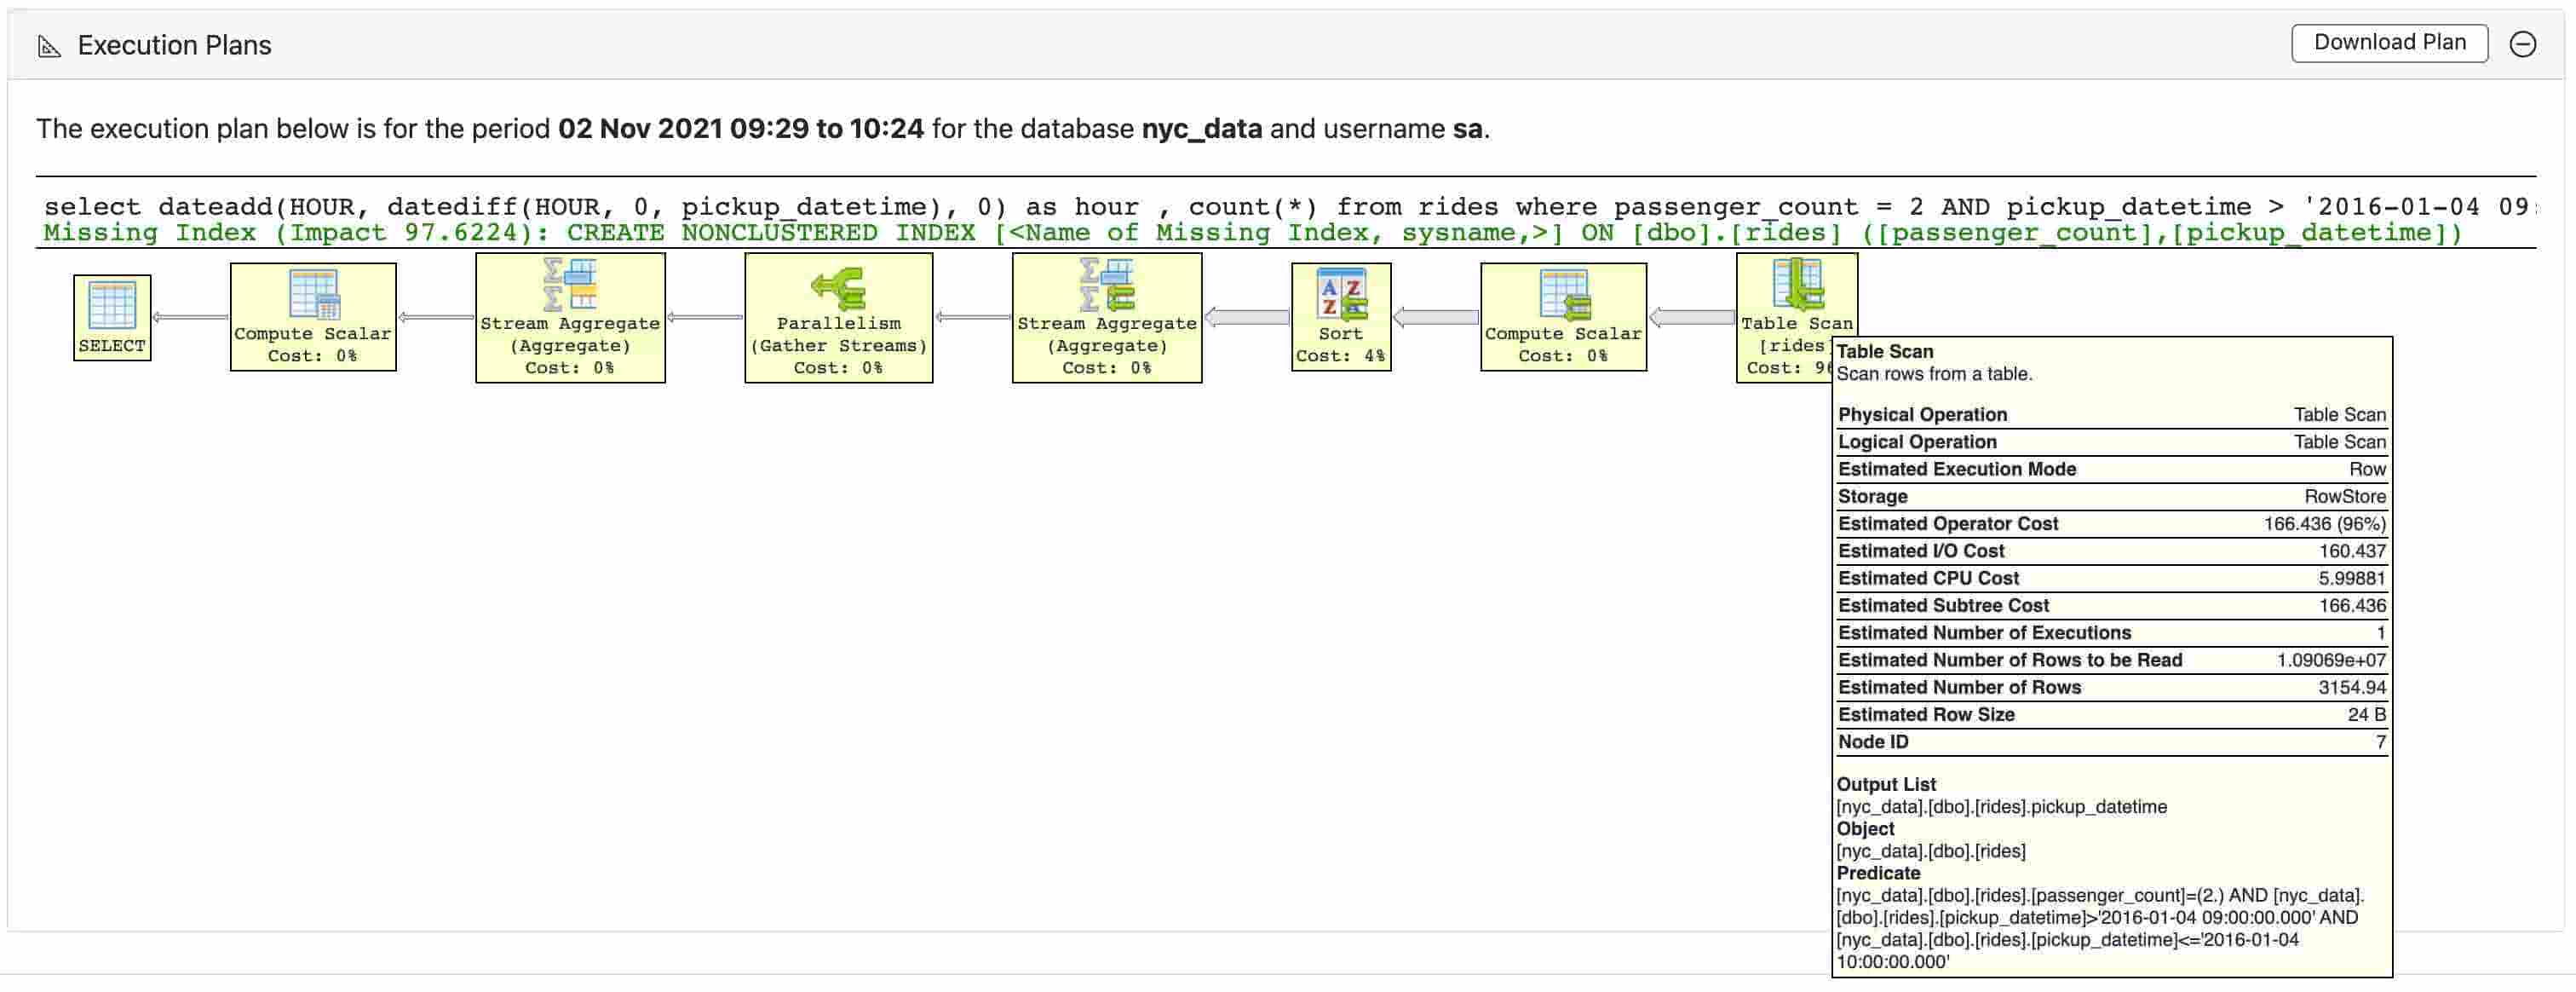
The plan format for SQL Server is similar to what you might see in Microsoft SQL Management Studio. It also includes recommendations such as missing indexes as seen below.
To understand how to interpret an execution plan see the knowledge base section here.
Statement activity tab
This is like the Database activity screen, except that it is filtered to only show the activity from a single SQL statement.
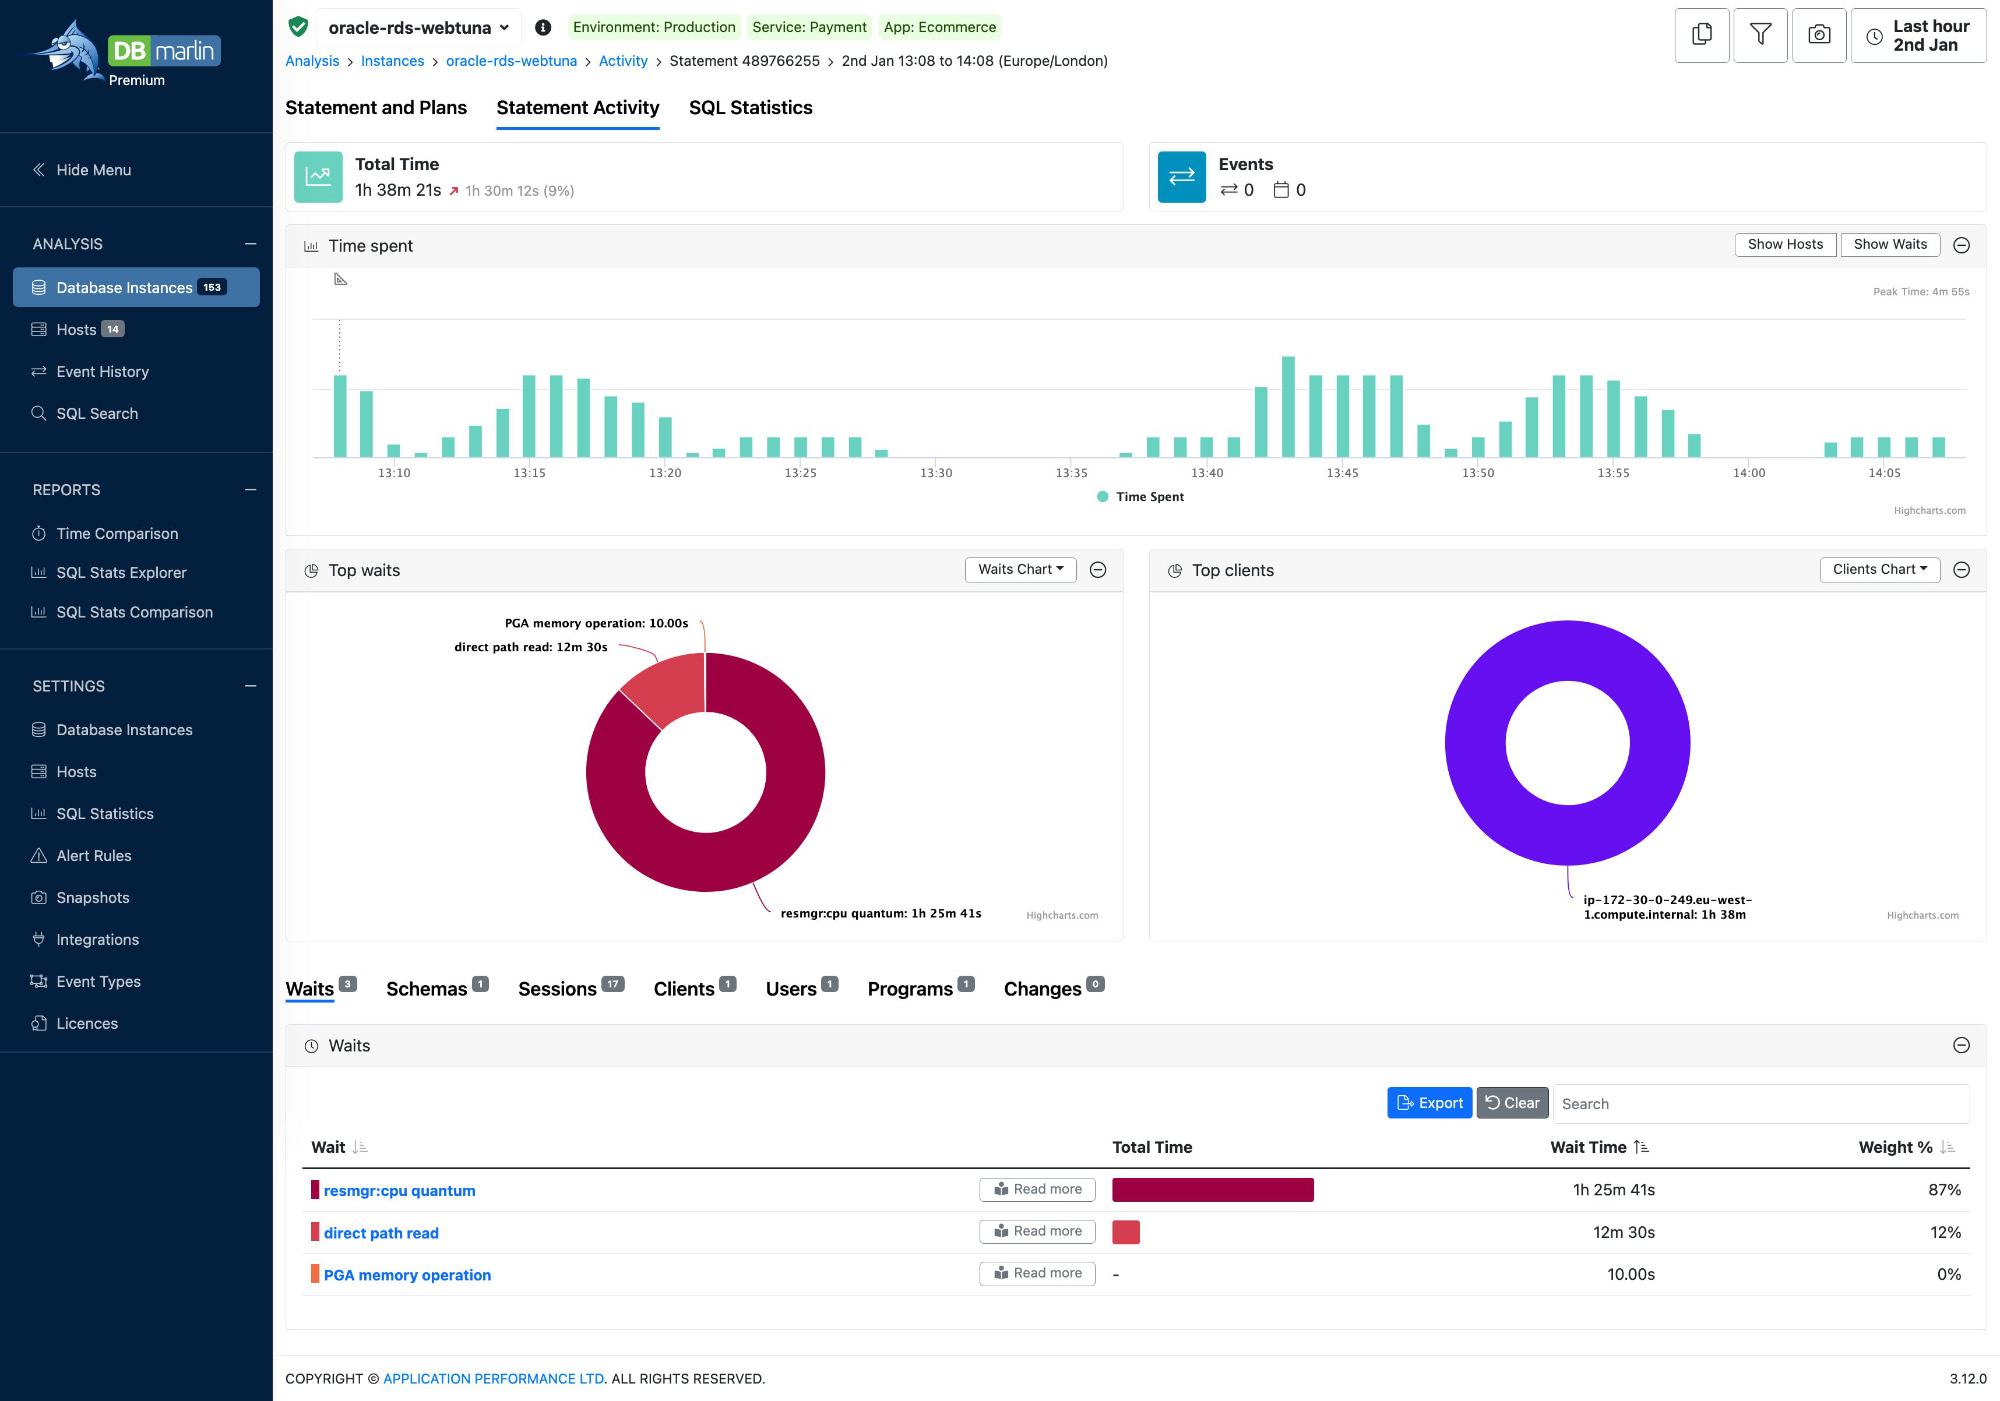
KPI Widgets

The key performance indicators at the top of the screen are there to show top level metrics and alerts.
- Total Time - This is the total amount of time spent executing this SQL statement within the selected period.
- Events - This shows 2 values: 1) the total number of changes within your environment such as schema changes or database parameter changes within the time range selected and 2) any custom events you have created for things like code releases or infrastructure changes.
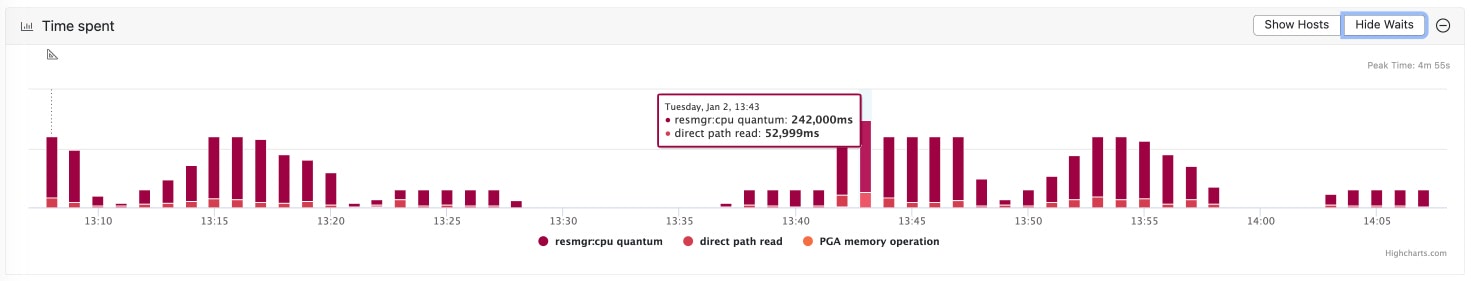
Statement performance over time
This shows the DB time and wait states over time for the SQL statement. You can optionally toggle the wait-states on of off with the button in the top right.
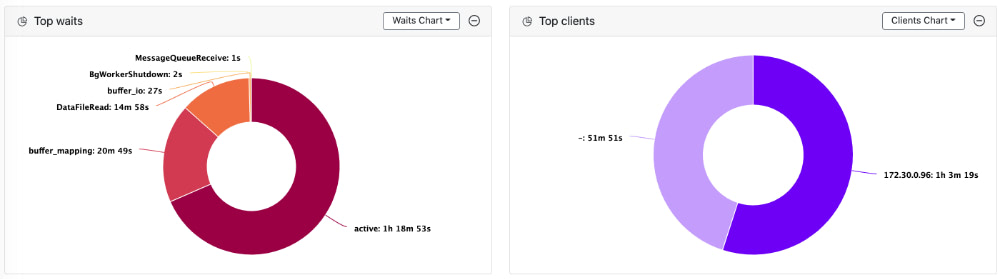
Statement breakdown
- The chart shows where the SQL was executed from. For example which client, user, program and database the SQL was run against.
- The charts shows a breakdown of the SQL statement time by wait state.
You can also use the lower tabs to get a breakdown of time for the SQL statement in tabular form. You can see the time split by Waits, Databases/Schemas, Sessions, Clients, Users or Programs.
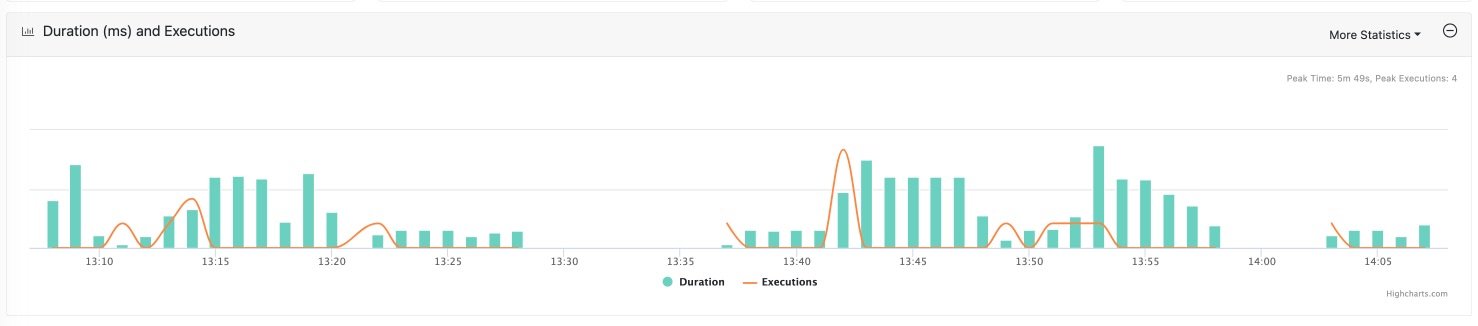
SQL statistics tab
This is like the SQL Statistics tab at the instance level except that it is filtered to only show the statistics for a single SQL statement.
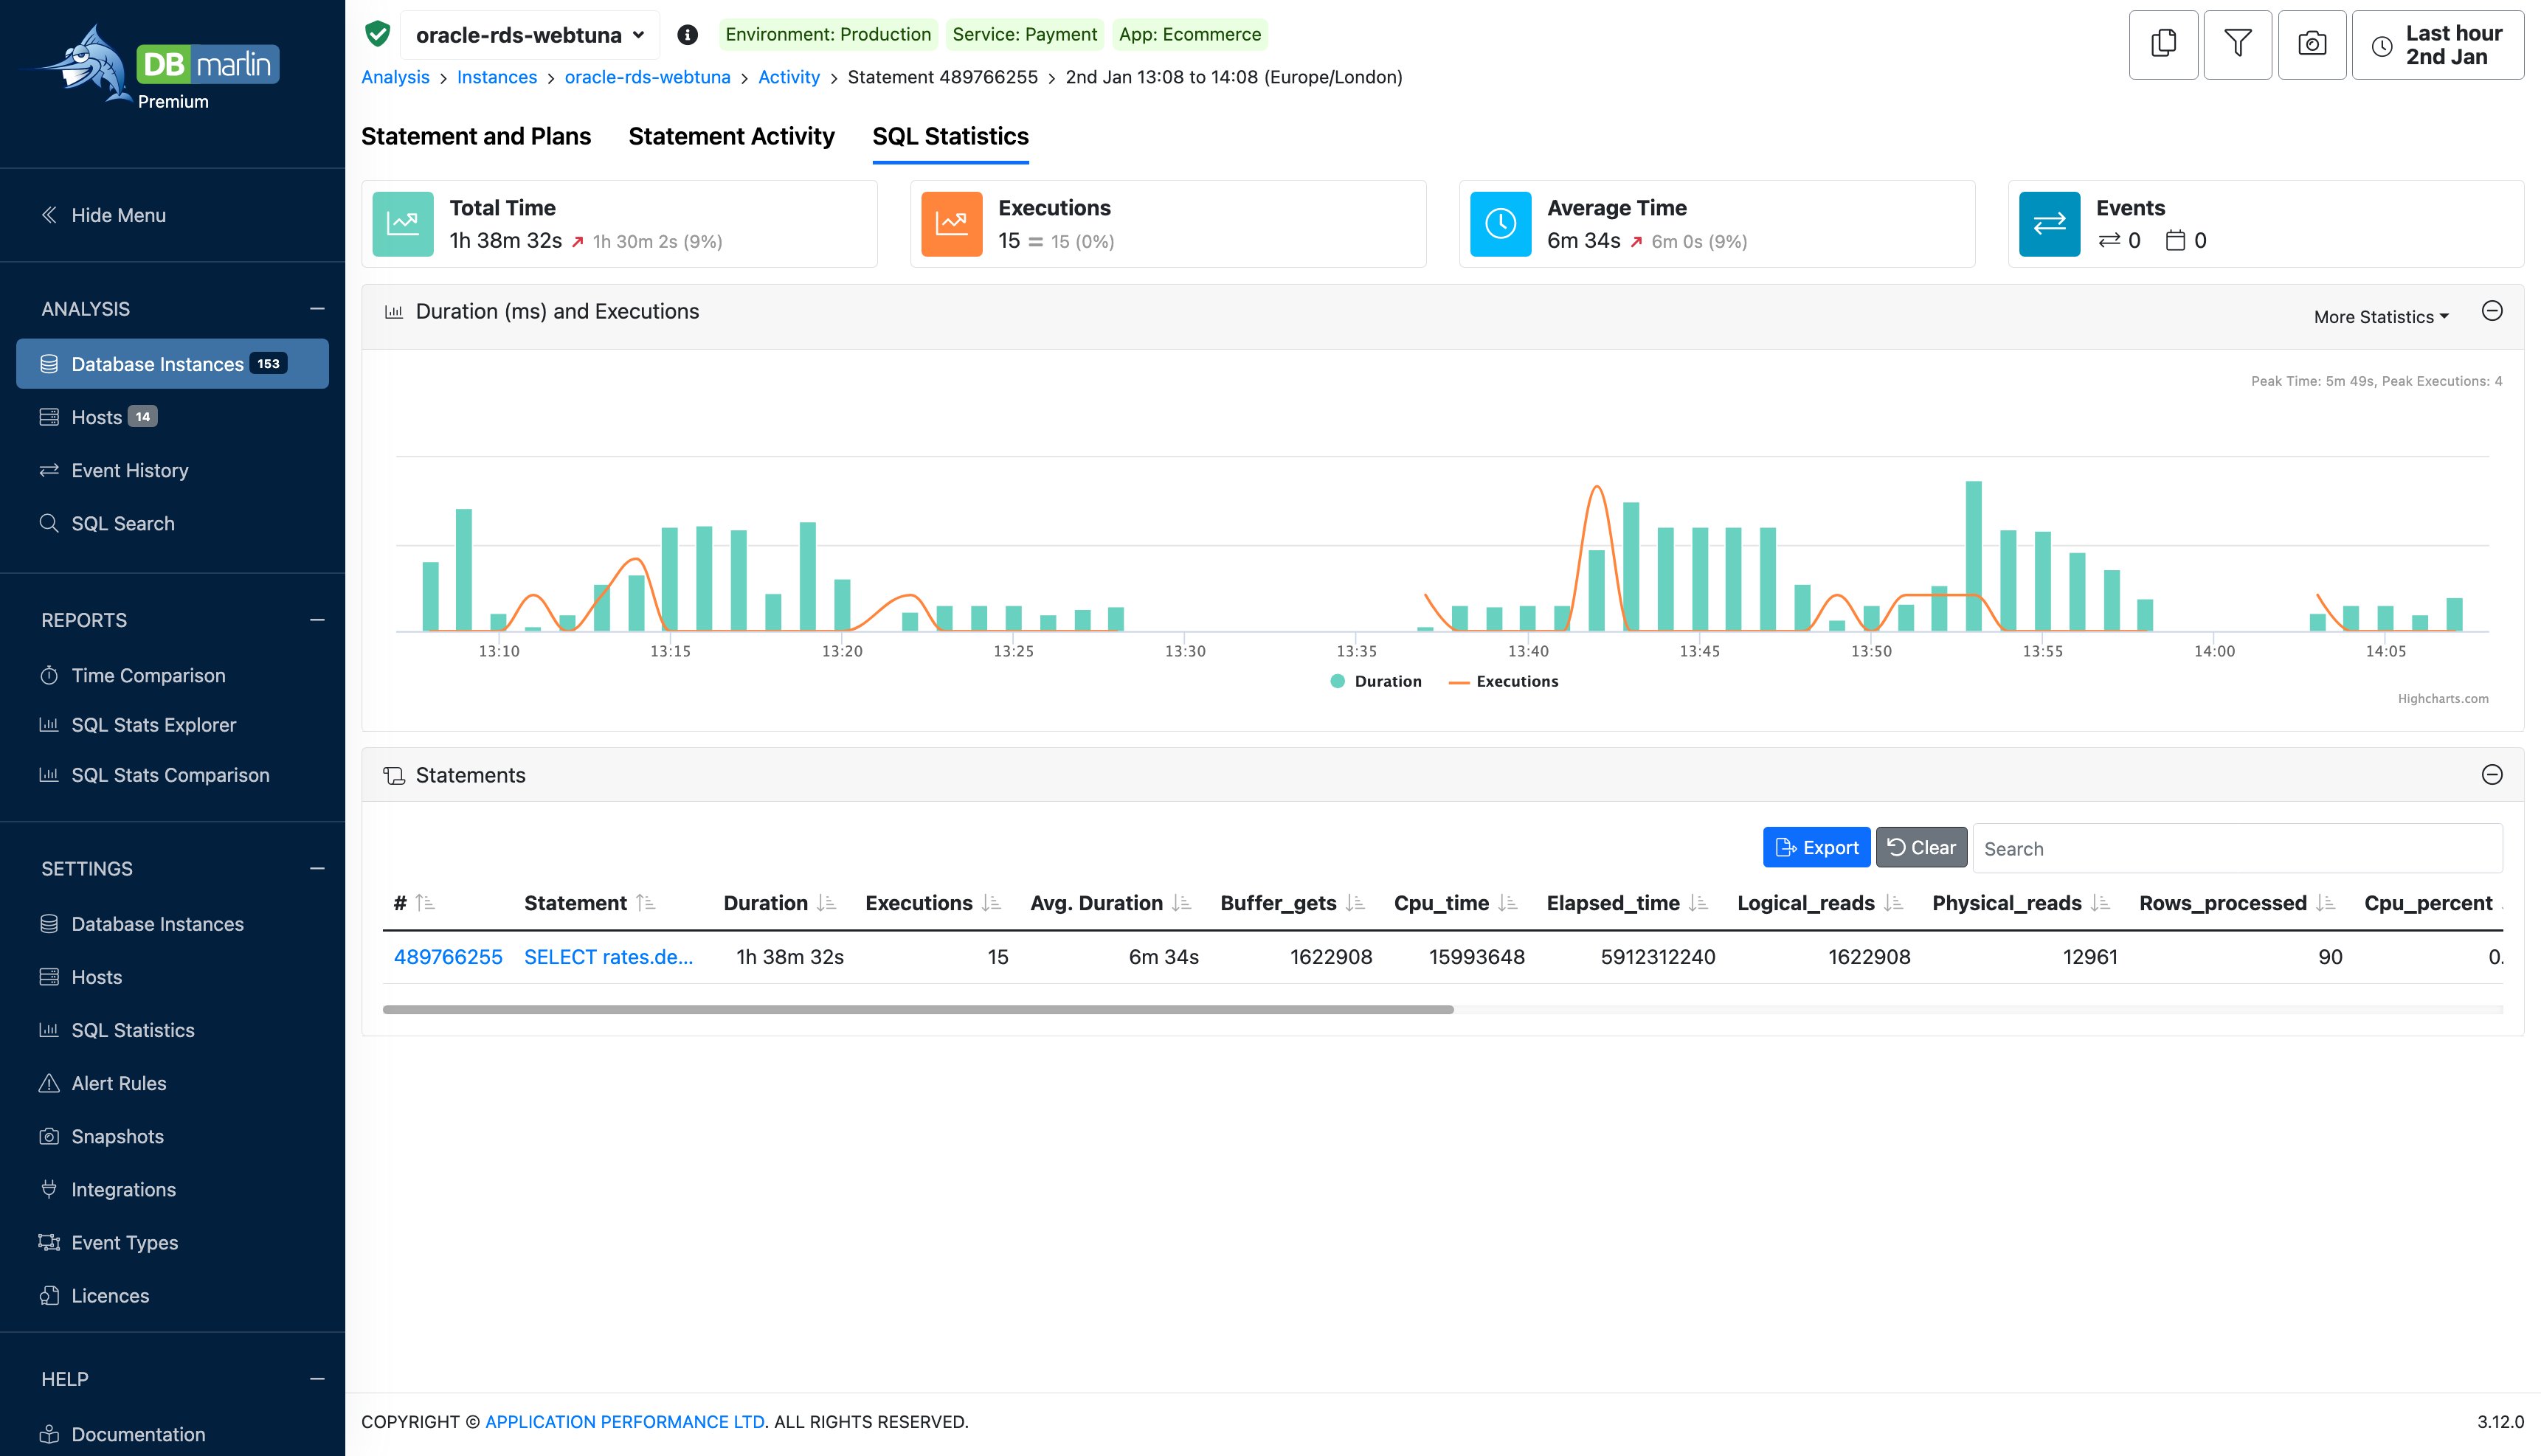
KPI Widgets

- Total Time - This is the total amount of time spent executing this SQL statement within the selected period.
- Executions - This is the total number of executions for the SQL statement within the selected period (not always available depending on the database type)
- Average Time - This is the average SQL response time within the selected period (not always available depending on the database type)
- Events - This shows 2 values: 1) the total number of changes within your environment such as schema changes or database parameter changes within the time range selected and 2) any custom events you have created for things like code releases or infrastructure changes.
Statement performance over time
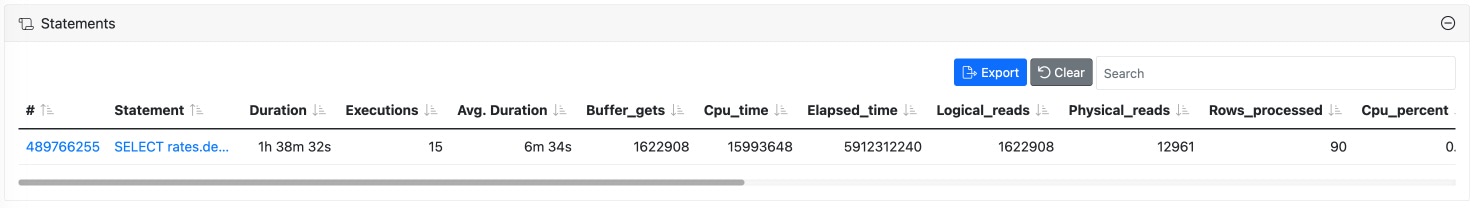
Statement table
Since this is filtered on an individual statement there will only be a single row in the table showing all available SQL statistics for the statement.