Event History view
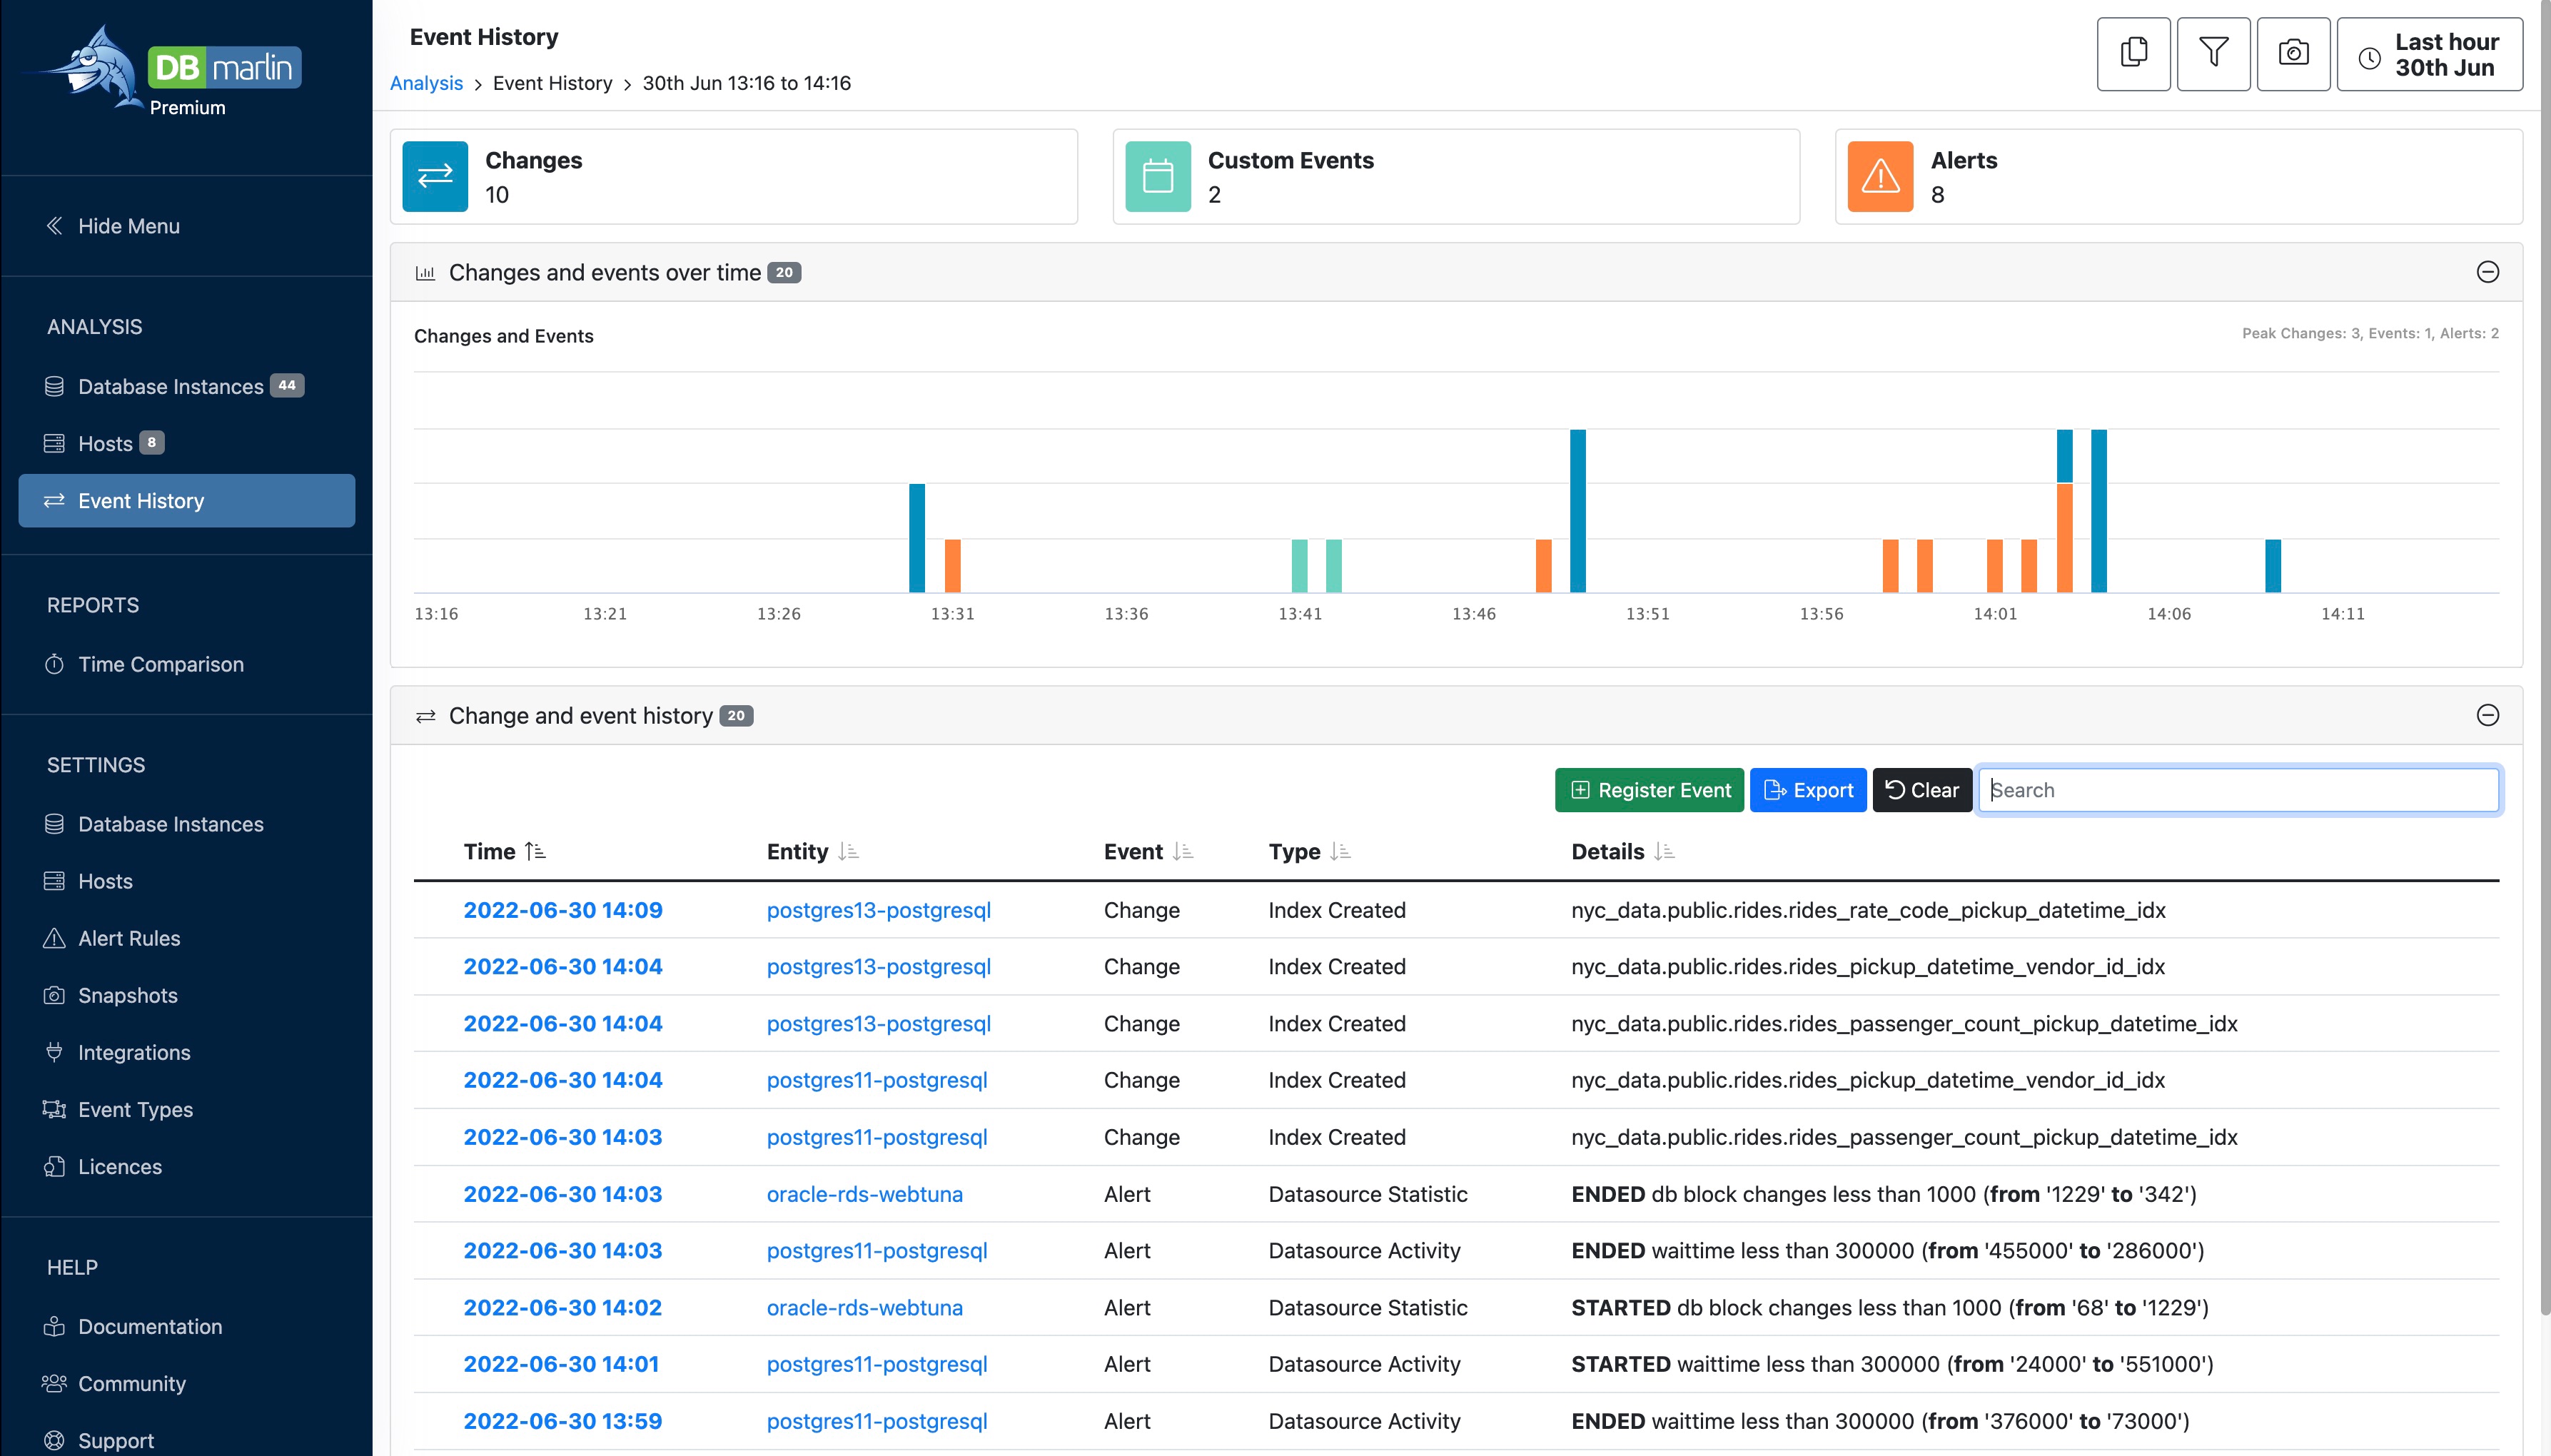
The Event History screen gives a list of any changes, custom events or alerts within your environment.
- Change events - These include schema changes or database parameter changes that are auto-detected.
- Custom events - You can also register other change events that aren't detected automatically. This is useful for tracking code releases or infrastructure changes for example. These can also be added via the API, through integrations such as Jenkins or manually created in the UI.
- Alert events - These are events for either the start or end when an alert. i.e. either when the alert rule threshold was crossed to trigger the alert or when the alert returned to normal.
The list can be filtered using the Search box. E.g. Search for 'Alert' to just see alerts in the list. The list can also be sorted or exported to CSV.
Alert event count
Alert events include both the STARTED and ENDED events so the total count could include both if the alert started and ended with in the selected time period.
Change detection frequency
Change detection runs as a background process that is scheduled every 5 minutes by default so the actual change time could be anytime within the last 5 mins of when the change was detected. This means that sometime the change marker might not line up exactly with the performance impact of the chance. If you would like to run change detection more frequently see the FAQ here.
Schema changes detected
The following types of changes are detected automatically:
- Drop or create table
- Drop or create index
- Drop or create database
Other schema changes can be detected by linking the tool you use to manage database schema changes to the DBmarlin API. For Liquibase for example, there is an integration available on GitHub.