Instances Overview
The Instances dashboard screen gives a high-level performance overview across all database instances.
If you mouseover the health icon you can see the status of the instance as a tooltip. If you mouseover the database icon you can see the database type and version as a tooltip. You can use the Search box to filter the table by any of the visible columns as well as hidden columns such as database version.
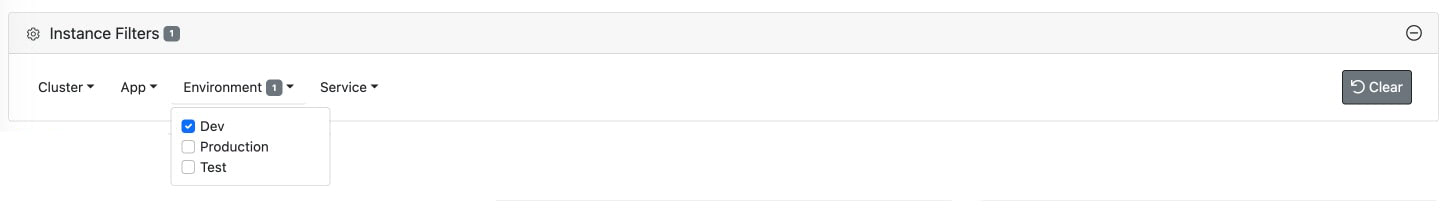
Tag Filter Panel
The tag filter panel is hidden by default. Clicking the + button will expand it. The panel will show any tag names you have applied to your instances. Clicking the tag name will show a dropdown list of tag values for that tag name. Click on the tag values will apply a filter so only matching instances will be shown in the panels below.
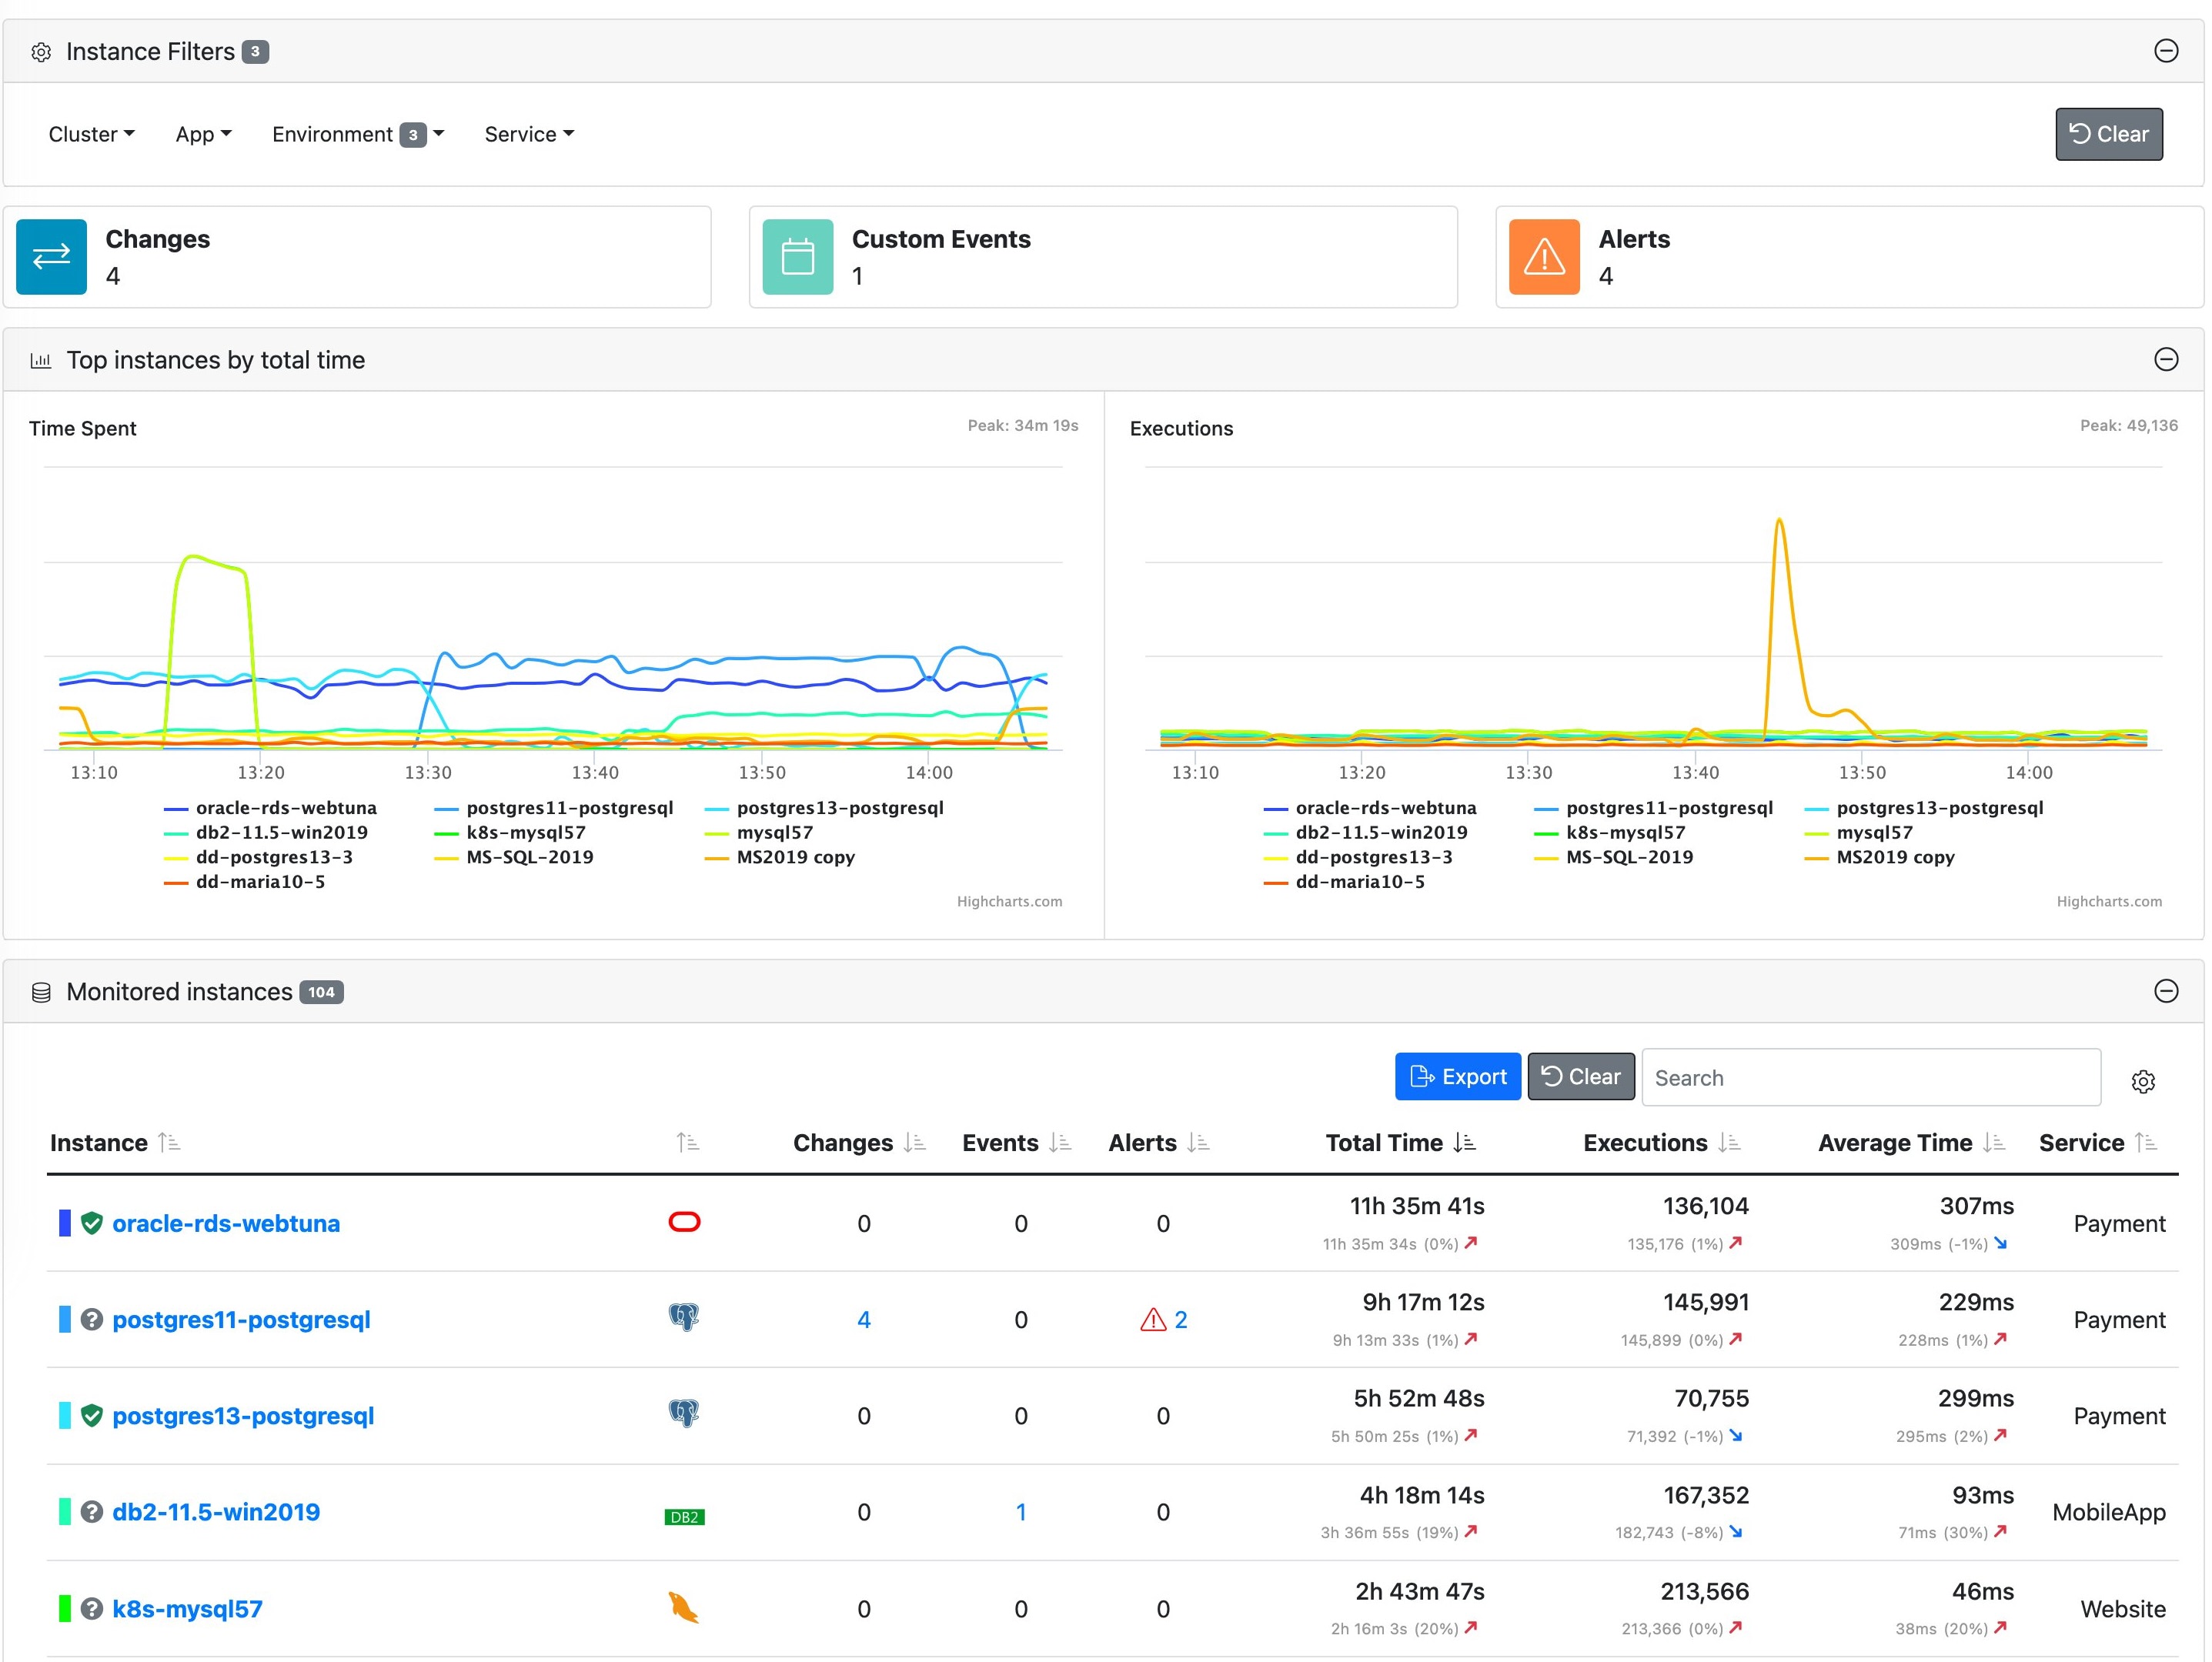
Event Widgets
The key performance indicators at the top of the screen are there to show top level metrics and alerts.

- Changes - This is the total number of auto-detected changes for all databases within the selected period.
- Custom Events - This is the total number of custom events for all databases within the selected period.
- Alerts - This is the total number of alerts started or ended within the period.
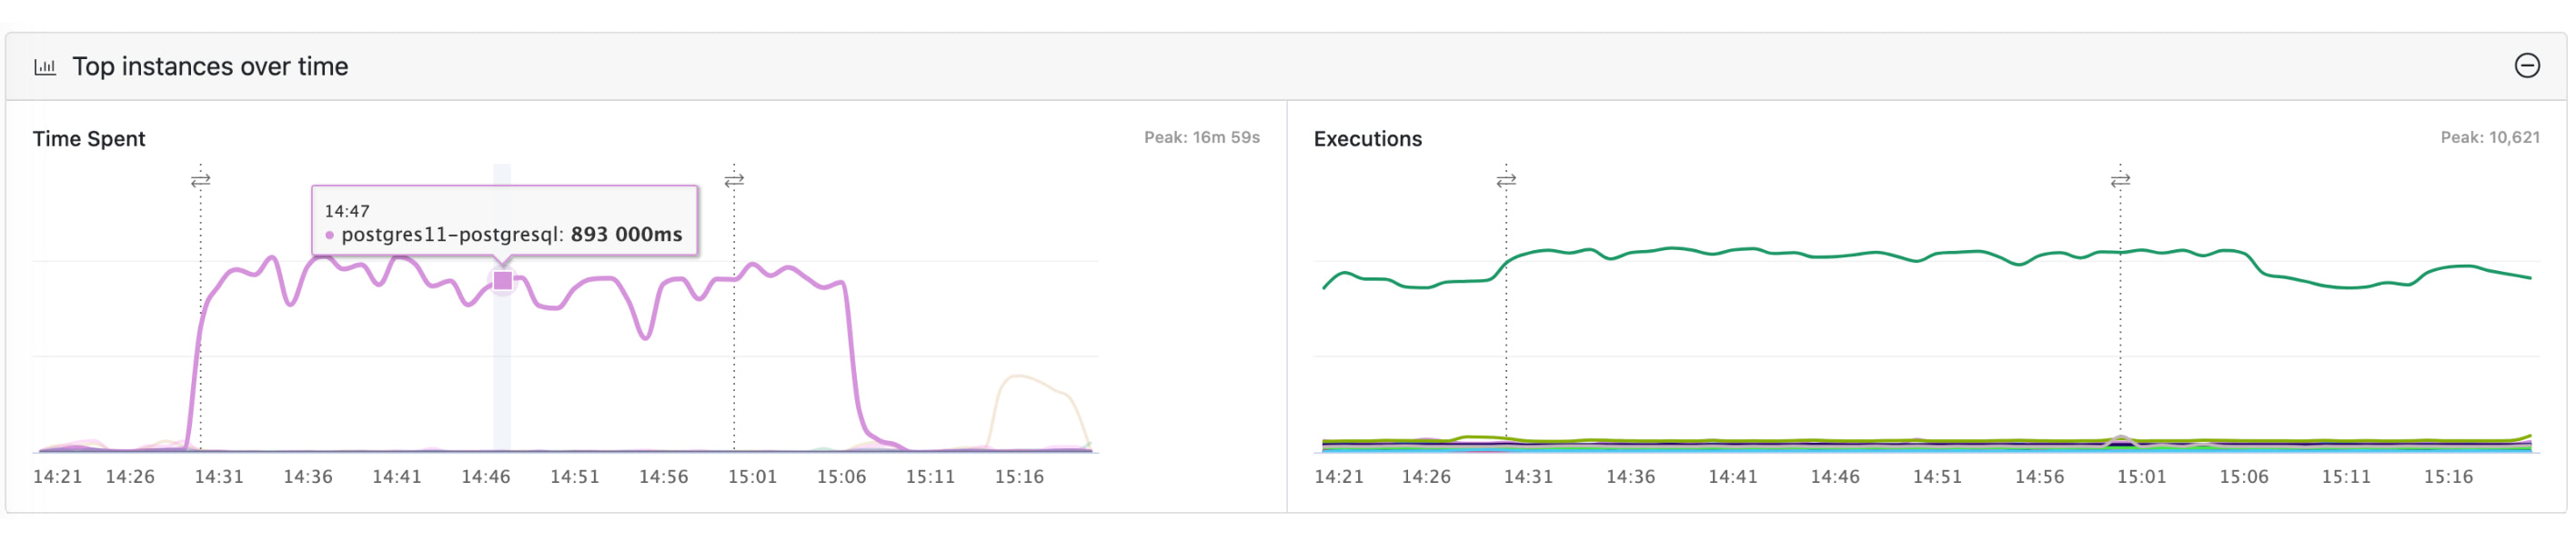
Top Databases over time
The 2 charts show DB Time and Executions over time for the period selected for all databases so you can see how they compare. You can toggle each database on or off by clicking on the legend. This widget may be hidden or viewed using the + or - symbols on the top right of the element. Mouseover any of the data series in either chart shows a tooltip with information about the nearest data point.
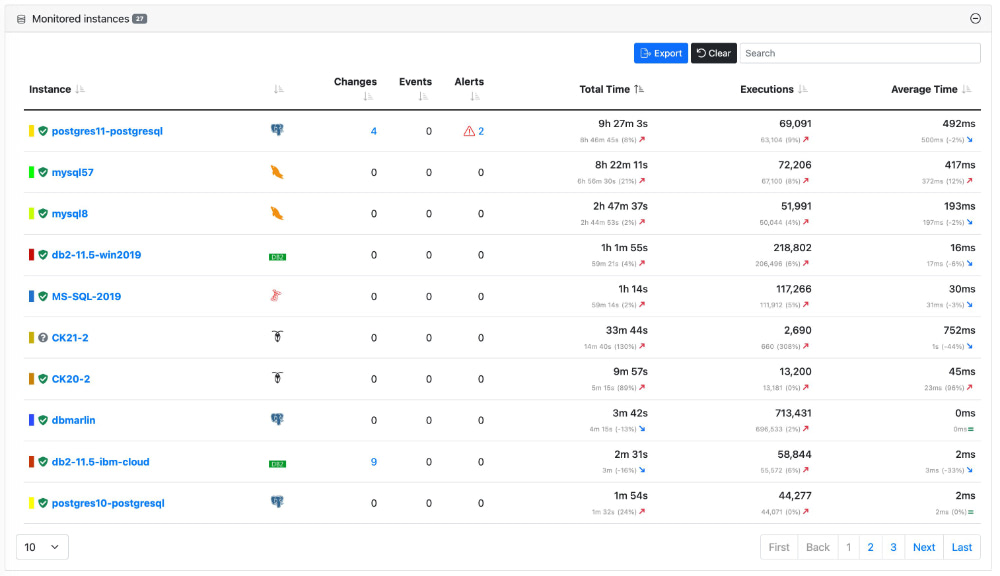
Monitored Databases table
The table shows all database instances which can be sorted by any column by clicking on the heading. The table can be filtered using the search box and exported to CSV using the export button. The shield symbol/colour indicates the status of the monitored database. This widget / element may be hidden or viewed using the + or - symbols on the top right of the element.
An individual database target may be selected by clicking on the name, to move to the Instance Dashboard, where more detailed information for the selected instance is available