SQL Stats Comparison
The SQL Stats Comparison lets you compare SQL statistics for the top N statements between any 2 time periods you choose.
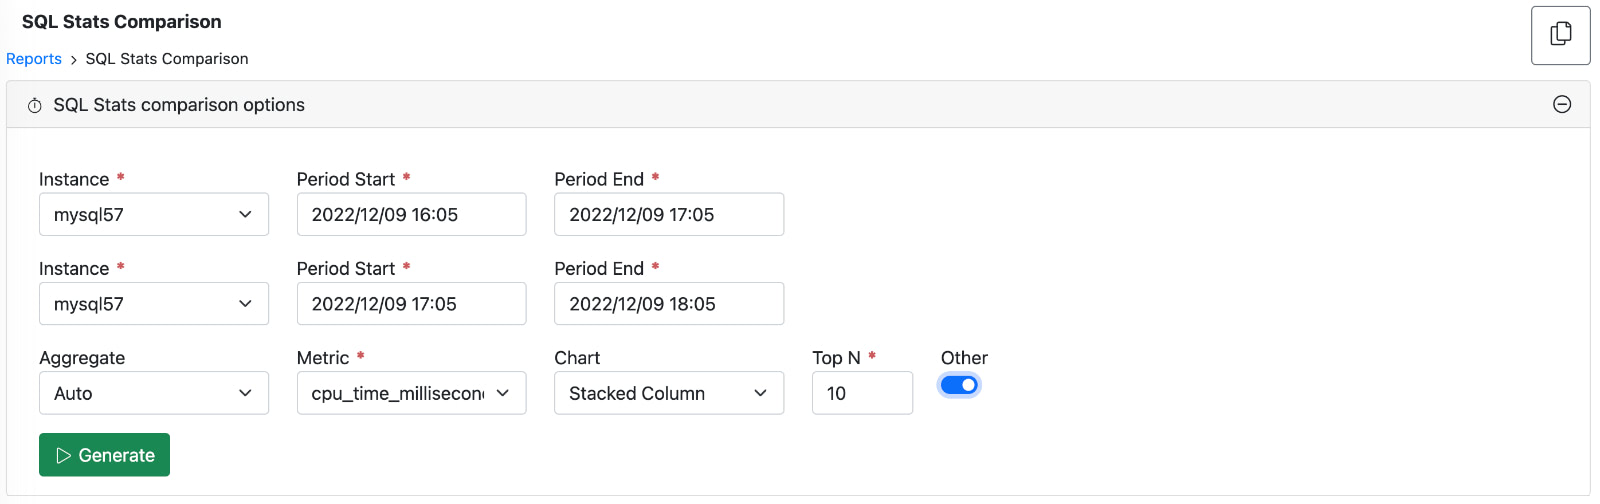
Report settings
- Select 2 Instances for comparison - Can be the same or different.
- Select 2 Periods for comparison.
- Select the Aggregation interval
- Auto = DBmarlin will pick the best interval for the time range you have selected.
- Timeslice = Will use the lowest granularity which by default is 1 minute but can be configure to a higher lower value by changing Batch interval under Settings -> Advanced Mode.
- Select the Metric. By default
- Select the Chart type (Stacked area, Stacked column or Multi-series line chart)
- Select the Top n value. Default is top 10 but can go to a maximum of 99. The higher the value the longer the report will take to generate.
- Select if Other should also be included on the chart. This add an extra series to the chart which is the sum of all other SQL statements outside of the Top n.
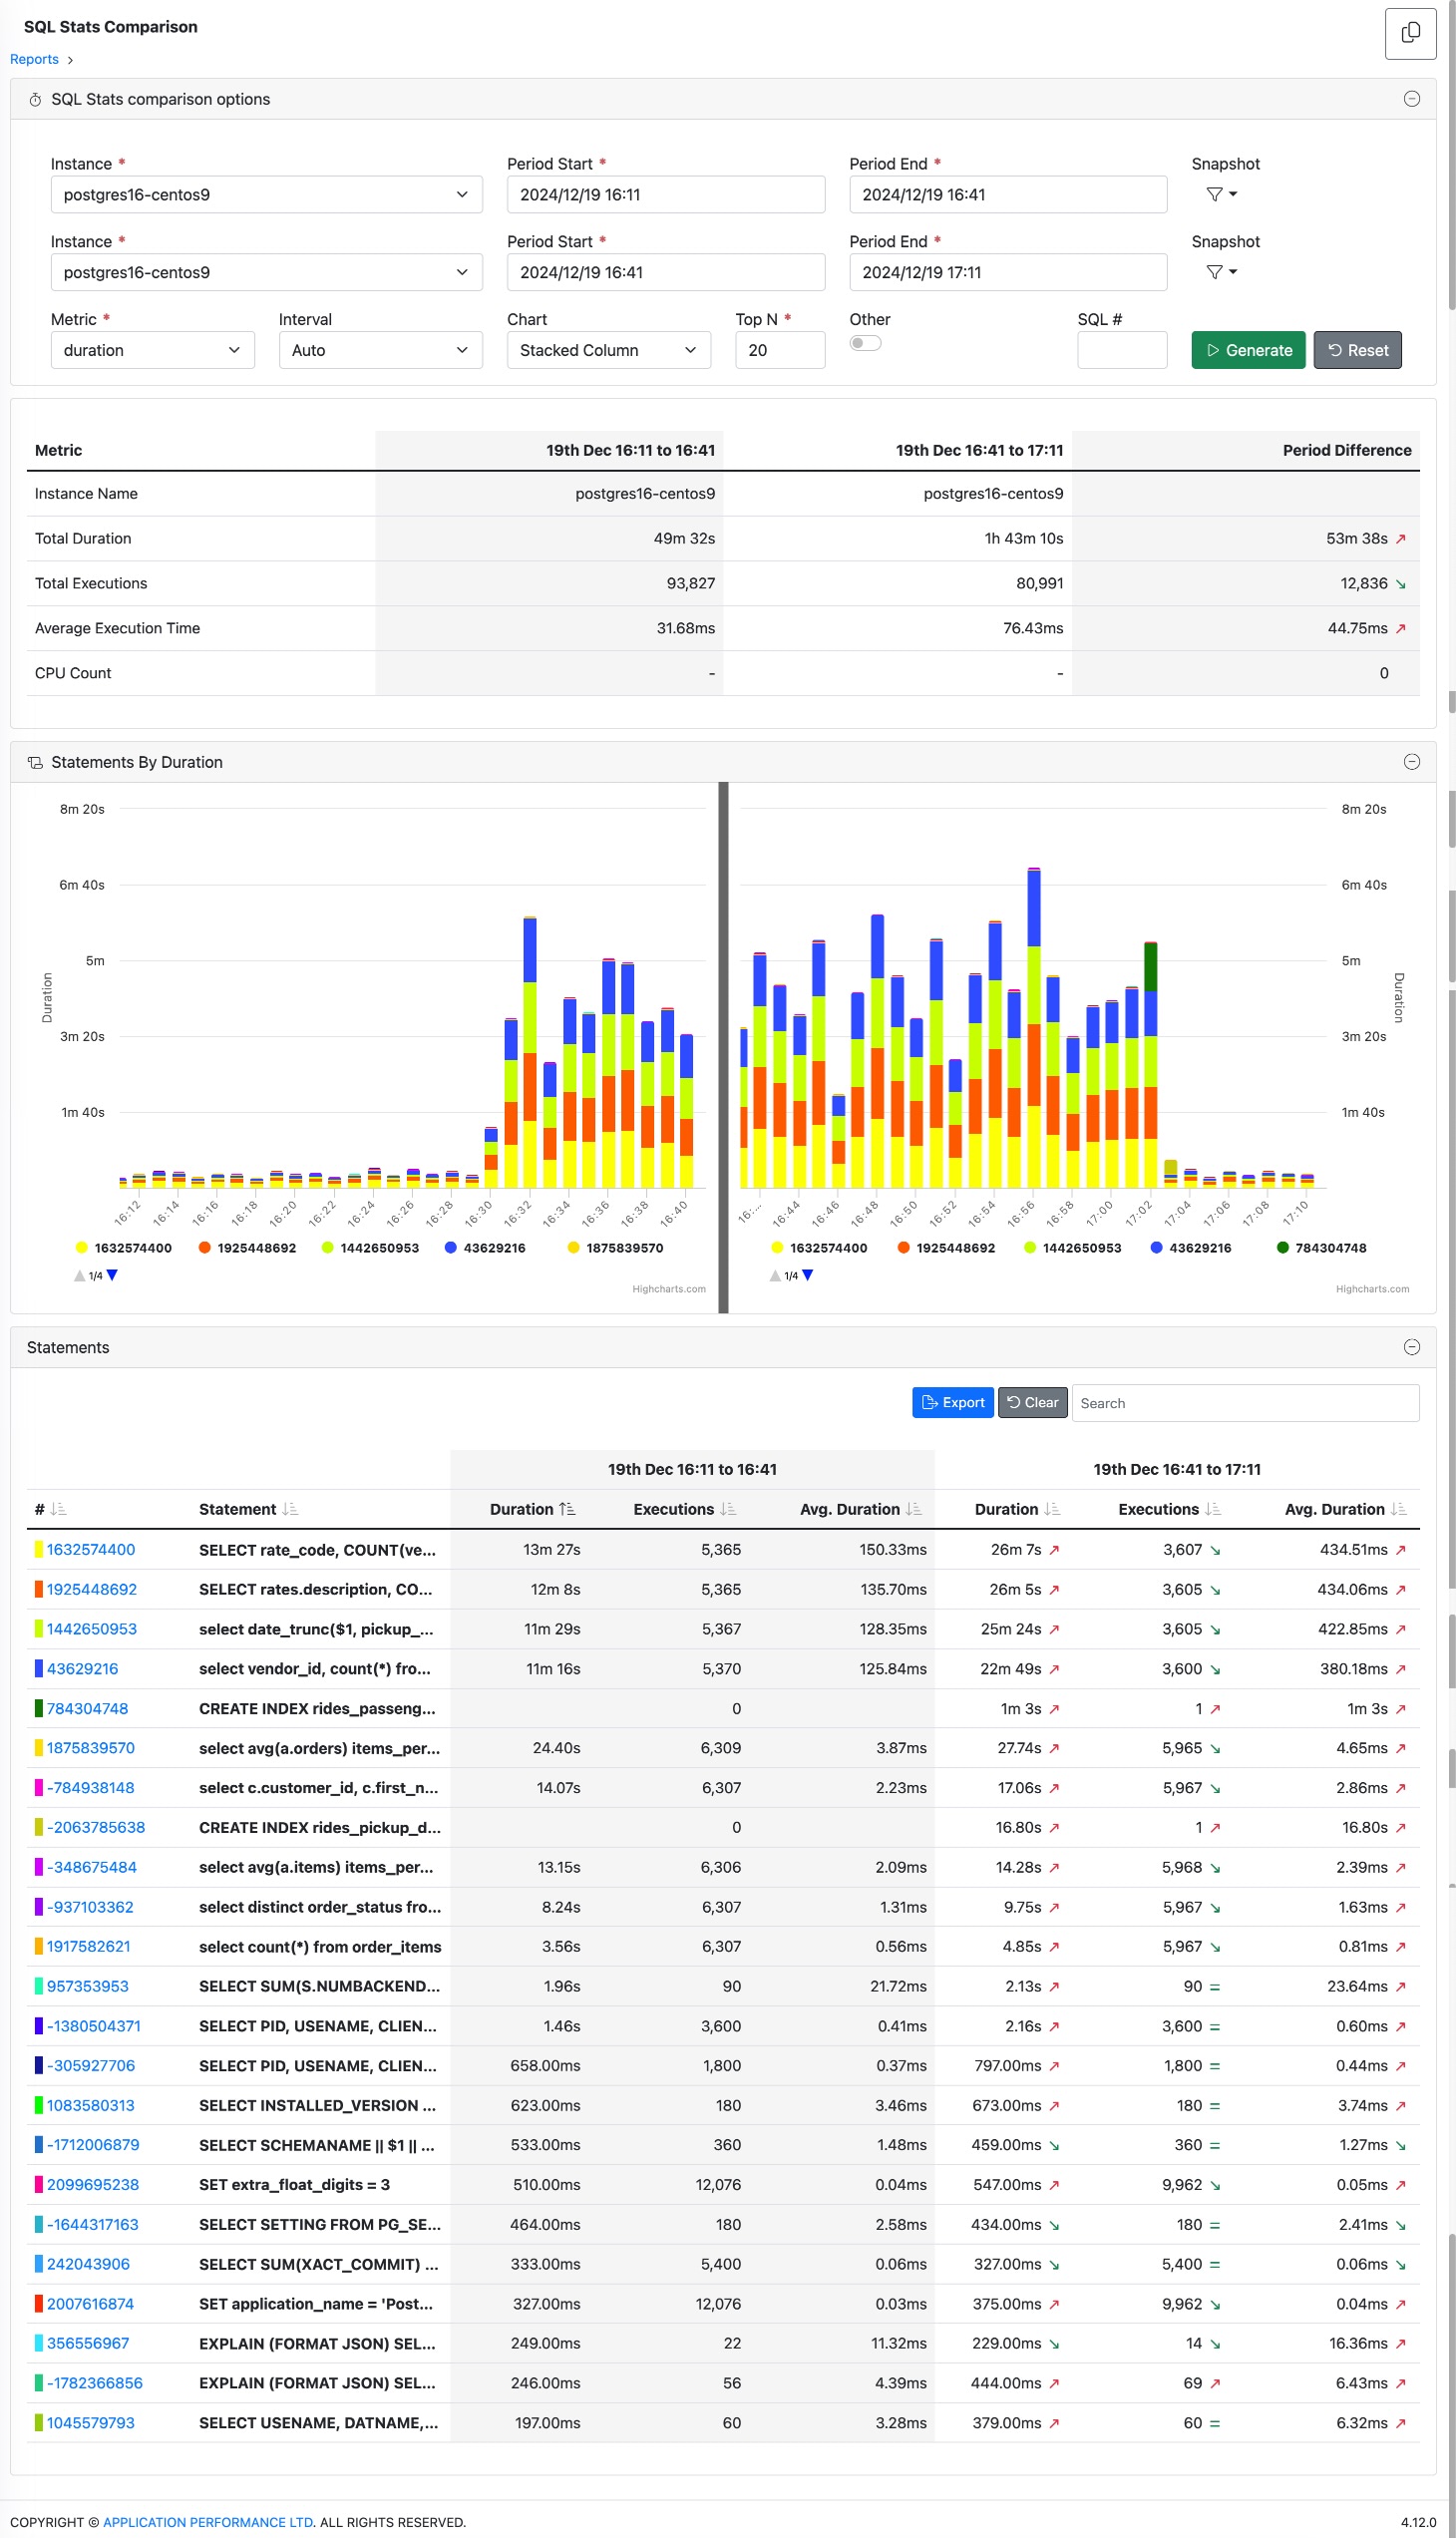
Report output
- The top of the report shows a table comparing the key performance metrics plus the selected metric.
- The chart below shows the top n statements with their SQL statistics for the 2 selected periods.
- The bottom table shows the same top n statements with their SQL statistics for the 2 selected periods.
Example report
Further drill down
- Clicking on the SQL hash or Statement text in the table will take you to the SQL screen where you can see the SQL Stats just for the selected statement or go to the activity view to see the programs, users, databases, sessions that the statement was called from and any wait events that were blocking it.